OPEN-SOURCE SCRIPT
DataDoodles SD + Probability
DataDoodles SD + Probability
Overview:
The “DataDoodles SD + Probability” indicator is designed to provide traders with a statistical edge by leveraging standard deviation and probability metrics. This advanced tool calculates the annualized standard deviation, Z-score, and probability of price movements, offering insights into potential market direction with customizable alert thresholds.
Key Features:
1. Annualized Standard Deviation (Volatility) Calculation:
• Uses a user-defined period to compute the rolling standard deviation of daily returns.
• Annualizes the volatility, giving a clear picture of expected price fluctuations.
2. Probability of Price Movement:
• Calculates the probability of price moving up or down using a corrected Z-Score.
• Displays the probability percentage for both upward and downward movements.
3. Dynamic Alerts:
• Configurable alerts for upward and downward price movement probabilities.
• Receive alerts when the probability exceeds user-defined thresholds.
4. Projections and Visuals:
• Plots projected high and low price levels based on annualized volatility.
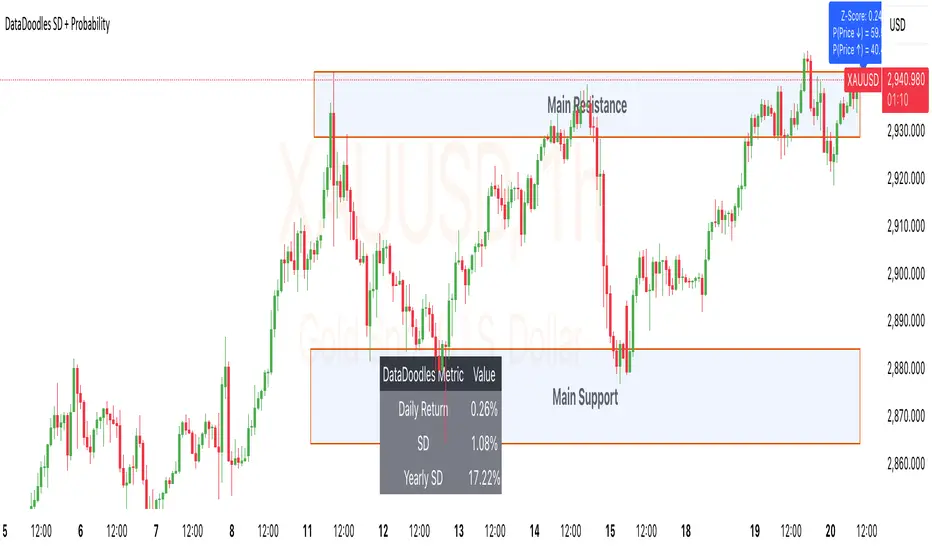
• Displays Z-Score and probability metrics on the chart for quick reference.
5. Comprehensive Data Table:
• Bottom-center table displays key metrics:
• Daily Return
• Standard Deviation (SD)
• Annualized Standard Deviation (Yearly SD)
User Inputs:
• Annualization Period: Set the time frame for volatility annualization (Default: 252 days).
• SD Period: Define the rolling window for calculating standard deviation (Default: 252 days).
• Alert Probability Up/Down: Customize the probability thresholds for alerts (Default: 90%).
How It Works:
• Data Request and Calculation:
• Uses daily close prices to ensure consistent timeframe calculations.
• Calculates daily returns and annualizes the volatility using the square root of the time frame.
• Probability Computation:
• Employs a normal distribution CDF approximation to compute the probability of upward and downward price movements.
• Adjusts probabilities based on Z-Score to ensure accuracy.
• High and Low Projections:
• Utilizes the annualized volatility to estimate high and low price projections for the year.
• Visual Indicators and Alerts:
• Plots projected high (green) and low (red) levels on the chart.
• Displays Z-Score, probability percentages, and dynamically updates a statistics table.
Use Cases:
• Trend Analysis: Identify high-probability market movements using the probability metrics.
• Volatility Insights: Understand annualized volatility to gauge market risk and potential price ranges.
• Strategic Trading Decisions: Set alerts for high-probability scenarios to optimize entry and exit points.
Why Use “DataDoodles SD + Probability”?
This indicator provides a powerful combination of statistical analysis and visual representation. It empowers traders with:
• Quantitative Edge: By leveraging probability metrics and standard deviation, users can make informed trading decisions.
• Risk Management: Annualized volatility projections help in setting realistic stop-loss and take-profit levels.
• Actionable Alerts: Customizable probability alerts ensure users are notified of potential market moves, allowing proactive trading strategies.
Recommended Settings:
• Annualization Period: 252 (Ideal for daily data representing a trading year)
• SD Period: 252 (One trading year for consistent volatility calculations)
• Alert Probability: Set to 90% for conservative signals or lower for more frequent alerts.
Final Thoughts:
The “DataDoodles SD + Probability” indicator is a robust tool for traders looking to integrate statistical analysis into their trading strategies. It combines volatility measurement, probability calculations, and dynamic alerts to provide a comprehensive market overview.
Whether you’re a day trader or a long-term investor, this indicator can enhance your market insight and improve decision-making accuracy.
Disclaimer:
This indicator is a technical analysis tool designed for educational purposes. Past performance is not indicative of future results. Traders are encouraged to perform their own analysis and manage risk accordingly.
Overview:
The “DataDoodles SD + Probability” indicator is designed to provide traders with a statistical edge by leveraging standard deviation and probability metrics. This advanced tool calculates the annualized standard deviation, Z-score, and probability of price movements, offering insights into potential market direction with customizable alert thresholds.
Key Features:
1. Annualized Standard Deviation (Volatility) Calculation:
• Uses a user-defined period to compute the rolling standard deviation of daily returns.
• Annualizes the volatility, giving a clear picture of expected price fluctuations.
2. Probability of Price Movement:
• Calculates the probability of price moving up or down using a corrected Z-Score.
• Displays the probability percentage for both upward and downward movements.
3. Dynamic Alerts:
• Configurable alerts for upward and downward price movement probabilities.
• Receive alerts when the probability exceeds user-defined thresholds.
4. Projections and Visuals:
• Plots projected high and low price levels based on annualized volatility.
• Displays Z-Score and probability metrics on the chart for quick reference.
5. Comprehensive Data Table:
• Bottom-center table displays key metrics:
• Daily Return
• Standard Deviation (SD)
• Annualized Standard Deviation (Yearly SD)
User Inputs:
• Annualization Period: Set the time frame for volatility annualization (Default: 252 days).
• SD Period: Define the rolling window for calculating standard deviation (Default: 252 days).
• Alert Probability Up/Down: Customize the probability thresholds for alerts (Default: 90%).
How It Works:
• Data Request and Calculation:
• Uses daily close prices to ensure consistent timeframe calculations.
• Calculates daily returns and annualizes the volatility using the square root of the time frame.
• Probability Computation:
• Employs a normal distribution CDF approximation to compute the probability of upward and downward price movements.
• Adjusts probabilities based on Z-Score to ensure accuracy.
• High and Low Projections:
• Utilizes the annualized volatility to estimate high and low price projections for the year.
• Visual Indicators and Alerts:
• Plots projected high (green) and low (red) levels on the chart.
• Displays Z-Score, probability percentages, and dynamically updates a statistics table.
Use Cases:
• Trend Analysis: Identify high-probability market movements using the probability metrics.
• Volatility Insights: Understand annualized volatility to gauge market risk and potential price ranges.
• Strategic Trading Decisions: Set alerts for high-probability scenarios to optimize entry and exit points.
Why Use “DataDoodles SD + Probability”?
This indicator provides a powerful combination of statistical analysis and visual representation. It empowers traders with:
• Quantitative Edge: By leveraging probability metrics and standard deviation, users can make informed trading decisions.
• Risk Management: Annualized volatility projections help in setting realistic stop-loss and take-profit levels.
• Actionable Alerts: Customizable probability alerts ensure users are notified of potential market moves, allowing proactive trading strategies.
Recommended Settings:
• Annualization Period: 252 (Ideal for daily data representing a trading year)
• SD Period: 252 (One trading year for consistent volatility calculations)
• Alert Probability: Set to 90% for conservative signals or lower for more frequent alerts.
Final Thoughts:
The “DataDoodles SD + Probability” indicator is a robust tool for traders looking to integrate statistical analysis into their trading strategies. It combines volatility measurement, probability calculations, and dynamic alerts to provide a comprehensive market overview.
Whether you’re a day trader or a long-term investor, this indicator can enhance your market insight and improve decision-making accuracy.
Disclaimer:
This indicator is a technical analysis tool designed for educational purposes. Past performance is not indicative of future results. Traders are encouraged to perform their own analysis and manage risk accordingly.
오픈 소스 스크립트
트레이딩뷰의 진정한 정신에 따라, 이 스크립트의 작성자는 이를 오픈소스로 공개하여 트레이더들이 기능을 검토하고 검증할 수 있도록 했습니다. 작성자에게 찬사를 보냅니다! 이 코드는 무료로 사용할 수 있지만, 코드를 재게시하는 경우 하우스 룰이 적용된다는 점을 기억하세요.
면책사항
해당 정보와 게시물은 금융, 투자, 트레이딩 또는 기타 유형의 조언이나 권장 사항으로 간주되지 않으며, 트레이딩뷰에서 제공하거나 보증하는 것이 아닙니다. 자세한 내용은 이용 약관을 참조하세요.
오픈 소스 스크립트
트레이딩뷰의 진정한 정신에 따라, 이 스크립트의 작성자는 이를 오픈소스로 공개하여 트레이더들이 기능을 검토하고 검증할 수 있도록 했습니다. 작성자에게 찬사를 보냅니다! 이 코드는 무료로 사용할 수 있지만, 코드를 재게시하는 경우 하우스 룰이 적용된다는 점을 기억하세요.
면책사항
해당 정보와 게시물은 금융, 투자, 트레이딩 또는 기타 유형의 조언이나 권장 사항으로 간주되지 않으며, 트레이딩뷰에서 제공하거나 보증하는 것이 아닙니다. 자세한 내용은 이용 약관을 참조하세요.