OPEN-SOURCE SCRIPT
Multiple Moving Averages with Offset
User Description:
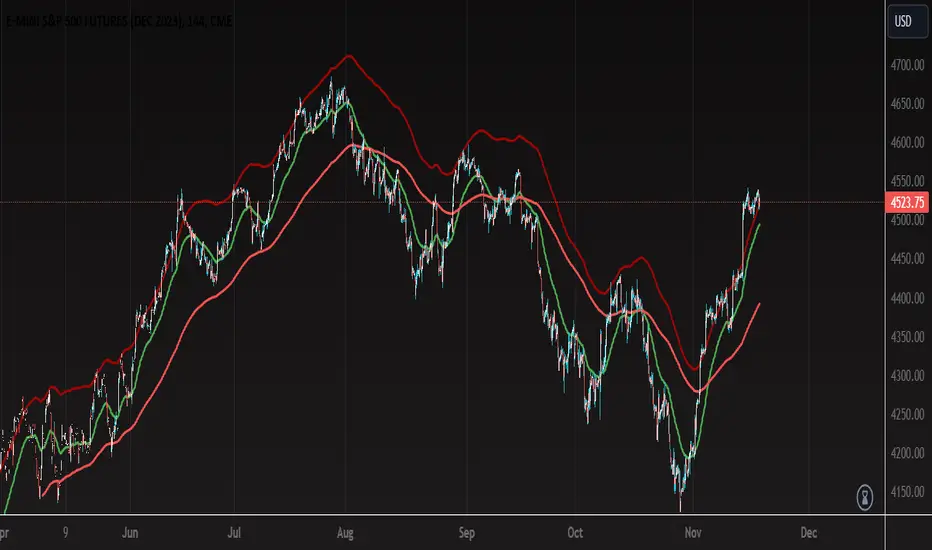
This indicator is designed to provide insights into market trends based on multiple moving averages with customizable offsets. It combines short-term and long-term moving averages to offer a comprehensive view of price movements. The user can adjust various parameters to tailor the indicator to their preferred settings.
How the Strategy Works:
Short-Term Fast Moving Average:
Length: 47 (Adjustable by the user)
Offset: Adjustable (User-defined)
Color: Green
Line Thickness: 2 (Thicker green line for better visibility)
Long-Term Fast Moving Average:
Length: 203 (Adjustable by the user)
Offset: Adjustable (User-defined)
Color: Red
Line Thickness: 2 (Thicker red line for better visibility)
Long-Term Slow Moving Average:
Length: 100 (Adjustable by the user)
Offset: 77 (Adjustable by the user)
Color: Custom Red (RGB: 161, 5, 5)
Line Thickness: 2 (Thicker red line for better visibility)
Interpretation:
When the Short-Term Fast Moving Average (green line) is above the Long-Term Fast Moving Average (red line), it may signal a potential uptrend.
Conversely, when the Short-Term Fast Moving Average is below the Long-Term Fast Moving Average, it may indicate a potential downtrend.
The Long-Term Slow Moving Average provides additional context, allowing users to assess the strength and stability of trends.
Customization:
Users can experiment with different lengths and offsets to fine-tune the indicator based on their trading preferences and market conditions.
TIPS:
- When price action reaches upper RED moving average is probable that the price action is close to a pull back or change of direction.
- When price action falls and closes below the bottom RED moving average it can be a possible change of direction to the downside.
- You can use the green moving average as a filter and confluence to identify if the price action is moving towards the upside or downside.
Note: This indicator is for informational purposes only and should be used in conjunction with other analysis tools for comprehensive decision-making.
오픈 소스 스크립트
트레이딩뷰의 진정한 정신에 따라, 이 스크립트의 작성자는 이를 오픈소스로 공개하여 트레이더들이 기능을 검토하고 검증할 수 있도록 했습니다. 작성자에게 찬사를 보냅니다! 이 코드는 무료로 사용할 수 있지만, 코드를 재게시하는 경우 하우스 룰이 적용된다는 점을 기억하세요.
Contact me for a free market analysis!!
면책사항
해당 정보와 게시물은 금융, 투자, 트레이딩 또는 기타 유형의 조언이나 권장 사항으로 간주되지 않으며, 트레이딩뷰에서 제공하거나 보증하는 것이 아닙니다. 자세한 내용은 이용 약관을 참조하세요.