OPEN-SOURCE SCRIPT
업데이트됨 Overnight vs Intra-day Performance

█ STRATEGY OVERVIEW
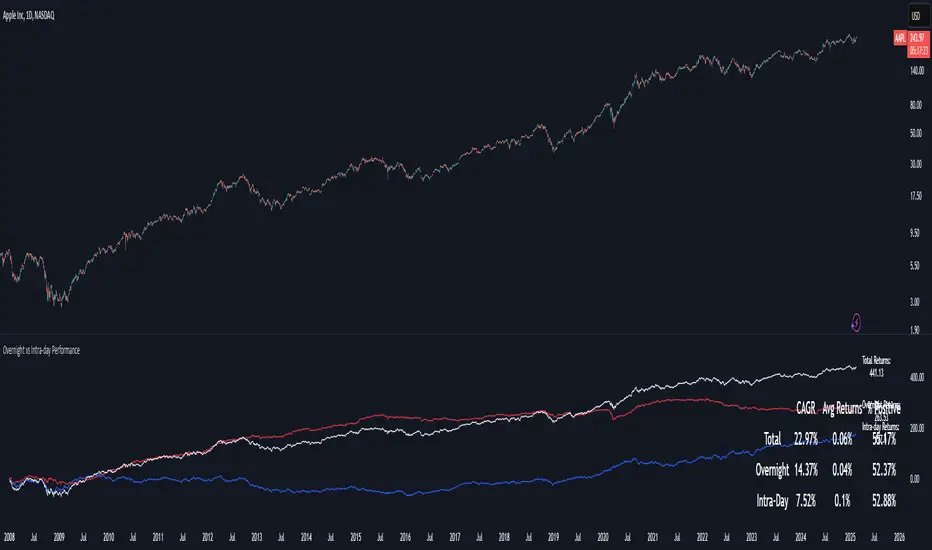
The "Overnight vs Intra-day Performance" indicator quantifies price behaviour differences between trading hours and overnight periods. It calculates cumulative returns, compound growth rates, and visualizes performance components across user-defined time windows. Designed for analytical use, it helps identify whether returns are primarily generated during market hours or overnight sessions.
█ USAGE
Use this indicator on Stocks and ETFs to visualise and compare intra-day vs overnight performance
█ KEY FEATURES
█ VISUALIZATION SYSTEM
1. Time-Series
2. Summary Table
3. Price Chart Labels
█ PURPOSE
█ IDEAL USERS
1. Portfolio Managers
2. Quantitative Researchers
3. Market Microstructure Analysts
4. Day Traders
The "Overnight vs Intra-day Performance" indicator quantifies price behaviour differences between trading hours and overnight periods. It calculates cumulative returns, compound growth rates, and visualizes performance components across user-defined time windows. Designed for analytical use, it helps identify whether returns are primarily generated during market hours or overnight sessions.
█ USAGE
Use this indicator on Stocks and ETFs to visualise and compare intra-day vs overnight performance
█ KEY FEATURES
- Return Segmentation: Separates total returns into overnight (close-to-open) and intraday (open-to-close) components
Growth Tracking: Shows simple cumulative returns and compound annual growth rates (CAGR)
█ VISUALIZATION SYSTEM
1. Time-Series
- Overnight Returns (Red)
- Intraday Returns (Blue)
- Total Returns (White)
2. Summary Table
- Displays CAGR
3. Price Chart Labels
- Floating annotations showing absolute returns and CAGR
- Color-coded to match plot series
█ PURPOSE
- Quantify market behaviour disparities between active trading sessions and overnight positioning
- Provide institutional-grade attribution analysis for returns generation
- Enable tactical adjustment of trading schedules based on historical performance patterns
- Serve as foundational research for session-specific trading strategies
█ IDEAL USERS
1. Portfolio Managers
- Analyse overnight risk exposure across holdings
- Optimize execution timing based on return distributions
2. Quantitative Researchers
- Study market microstructure through time-segmented returns
- Develop alpha models leveraging session-specific anomalies
3. Market Microstructure Analysts
- Identify liquidity patterns in overnight vs daytime sessions
- Research ETF premium/discount mechanics
4. Day Traders
- Align trading hours with highest probability return windows
- Avoid overnight gaps through informed position sizing
릴리즈 노트
Added average returns and percent positive오픈 소스 스크립트
트레이딩뷰의 진정한 정신에 따라, 이 스크립트의 작성자는 이를 오픈소스로 공개하여 트레이더들이 기능을 검토하고 검증할 수 있도록 했습니다. 작성자에게 찬사를 보냅니다! 이 코드는 무료로 사용할 수 있지만, 코드를 재게시하는 경우 하우스 룰이 적용된다는 점을 기억하세요.
면책사항
해당 정보와 게시물은 금융, 투자, 트레이딩 또는 기타 유형의 조언이나 권장 사항으로 간주되지 않으며, 트레이딩뷰에서 제공하거나 보증하는 것이 아닙니다. 자세한 내용은 이용 약관을 참조하세요.
오픈 소스 스크립트
트레이딩뷰의 진정한 정신에 따라, 이 스크립트의 작성자는 이를 오픈소스로 공개하여 트레이더들이 기능을 검토하고 검증할 수 있도록 했습니다. 작성자에게 찬사를 보냅니다! 이 코드는 무료로 사용할 수 있지만, 코드를 재게시하는 경우 하우스 룰이 적용된다는 점을 기억하세요.
면책사항
해당 정보와 게시물은 금융, 투자, 트레이딩 또는 기타 유형의 조언이나 권장 사항으로 간주되지 않으며, 트레이딩뷰에서 제공하거나 보증하는 것이 아닙니다. 자세한 내용은 이용 약관을 참조하세요.