PROTECTED SOURCE SCRIPT
업데이트됨 DSKOLI Table
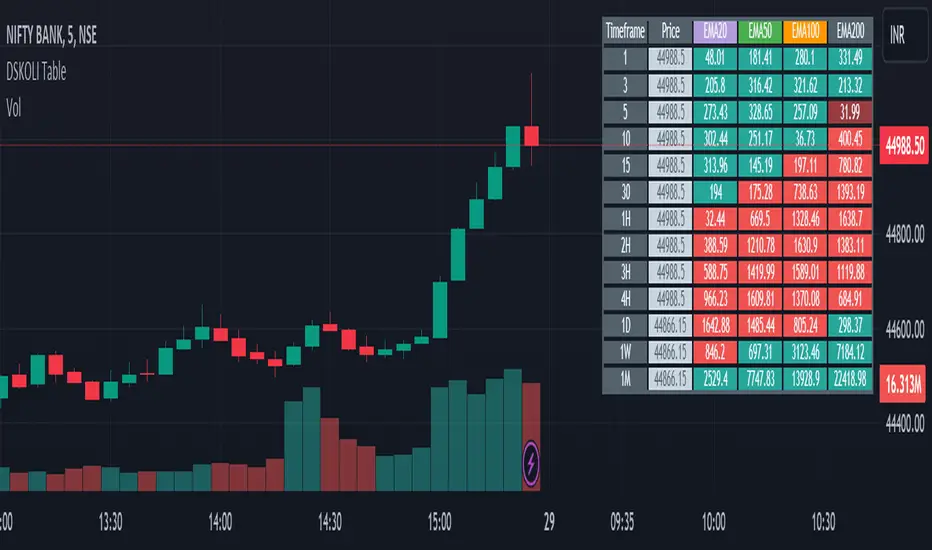
This helps to determine bullish or bearish trend of any chart on any generally available time-frame and good to have for Intraday watch.
Details -
a. Points shown in table shows the difference of last shown price from specified EMAs, this helps to know the price movement of candles are above or below the EMA and its coloured with red and green which even further helps to determine its existing trend.
Note or Disclaimer:
1. This may be considered only for Watching as Learning and informational purpose.
2. Take advice from financial advisor before entering, holding, converting or exiting from any order or trade.
3. Always keep your acceptable stop-loss in all your transactions while trading or investing.
DSKOLI or TradingView reserves all right and don't hold any responsibilities for any loss/losses as well as accuracy of levels or price movement.
릴리즈 노트
Update.릴리즈 노트
Update.릴리즈 노트
Update.릴리즈 노트
Update.릴리즈 노트
Update - Labels.릴리즈 노트
Update.릴리즈 노트
Update.릴리즈 노트
Update.보호된 스크립트입니다
이 스크립트는 비공개 소스로 게시됩니다. 하지만 이를 자유롭게 제한 없이 사용할 수 있습니다 – 자세한 내용은 여기에서 확인하세요.
면책사항
해당 정보와 게시물은 금융, 투자, 트레이딩 또는 기타 유형의 조언이나 권장 사항으로 간주되지 않으며, 트레이딩뷰에서 제공하거나 보증하는 것이 아닙니다. 자세한 내용은 이용 약관을 참조하세요.
면책사항
해당 정보와 게시물은 금융, 투자, 트레이딩 또는 기타 유형의 조언이나 권장 사항으로 간주되지 않으며, 트레이딩뷰에서 제공하거나 보증하는 것이 아닙니다. 자세한 내용은 이용 약관을 참조하세요.