OPEN-SOURCE SCRIPT
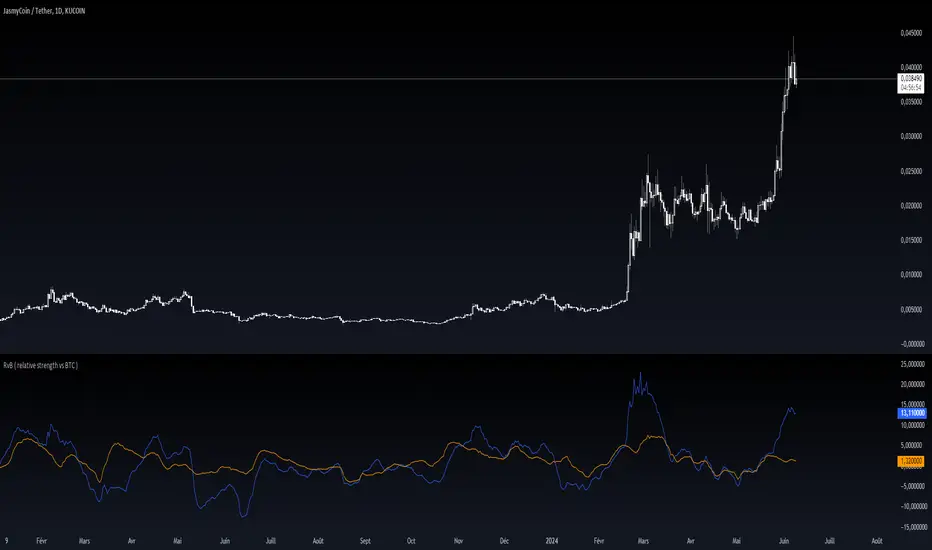
RvB ( relative strength vs BTC )
Overview
The "Coin vs BTC" indicator is designed to compare the performance of a selected cryptocurrency against Bitcoin (BTC) using Exponential Moving Averages (EMAs). By plotting the difference in EMA values as a percentage, this indicator helps traders visualize the relative strength of a cryptocurrency compared to Bitcoin over specified periods.
How It Works
EMA Calculation: The indicator calculates two EMAs (lengths specified by the user) for both the selected cryptocurrency and Bitcoin (BTC).
Length 1: Fast EMA (default: 9)
Length 2: Slow EMA (default: 21)
Score Calculation:
For both the selected coin and Bitcoin, it computes a score representing the percentage difference between the fast and slow EMAs relative to the previous closing price. This is done using the following steps:
Calculate the difference between the fast and slow EMAs.
Compute the percentage of this difference relative to the previous closing price.
Round the percentage to two decimal places for clarity.
Plotting: The scores for both the selected cryptocurrency and Bitcoin are plotted on the same chart:
Coin Score: Displayed in blue.
BTC Score: Displayed in orange.
Potential Uses
Relative Strength Analysis:
This indicator helps traders compare the strength of a cryptocurrency against Bitcoin. A higher score for the selected coin compared to Bitcoin indicates it is performing better relative to its moving averages.
Trend Confirmation:
By observing the EMA differences, traders can confirm trends and potential reversals. Consistently higher scores may indicate a strong upward trend, while lower scores could suggest a weakening trend.
Market Comparison:
This tool is particularly useful for those looking to understand how their selected cryptocurrency is performing in the broader market context, especially in relation to Bitcoin, which is often considered a market benchmark.
오픈 소스 스크립트
트레이딩뷰의 진정한 정신에 따라, 이 스크립트의 작성자는 이를 오픈소스로 공개하여 트레이더들이 기능을 검토하고 검증할 수 있도록 했습니다. 작성자에게 찬사를 보냅니다! 이 코드는 무료로 사용할 수 있지만, 코드를 재게시하는 경우 하우스 룰이 적용된다는 점을 기억하세요.
면책사항
해당 정보와 게시물은 금융, 투자, 트레이딩 또는 기타 유형의 조언이나 권장 사항으로 간주되지 않으며, 트레이딩뷰에서 제공하거나 보증하는 것이 아닙니다. 자세한 내용은 이용 약관을 참조하세요.
오픈 소스 스크립트
트레이딩뷰의 진정한 정신에 따라, 이 스크립트의 작성자는 이를 오픈소스로 공개하여 트레이더들이 기능을 검토하고 검증할 수 있도록 했습니다. 작성자에게 찬사를 보냅니다! 이 코드는 무료로 사용할 수 있지만, 코드를 재게시하는 경우 하우스 룰이 적용된다는 점을 기억하세요.
면책사항
해당 정보와 게시물은 금융, 투자, 트레이딩 또는 기타 유형의 조언이나 권장 사항으로 간주되지 않으며, 트레이딩뷰에서 제공하거나 보증하는 것이 아닙니다. 자세한 내용은 이용 약관을 참조하세요.