PROTECTED SOURCE SCRIPT
업데이트됨 Study - Mean Reversion Index
© fareidzulkifli
Disclaimer:
I always felt Pinescript is a very fast to type language with excellent visualization capabilities, so I've been using it as code-testing platform prior to actual coding in other platform.
Having said that, these study scripts was built only to test/visualize an idea to see its viability and if it can be used to optimize existing strategy.
While some of it are useful and most are useless, none of it should be use as main decision maker.
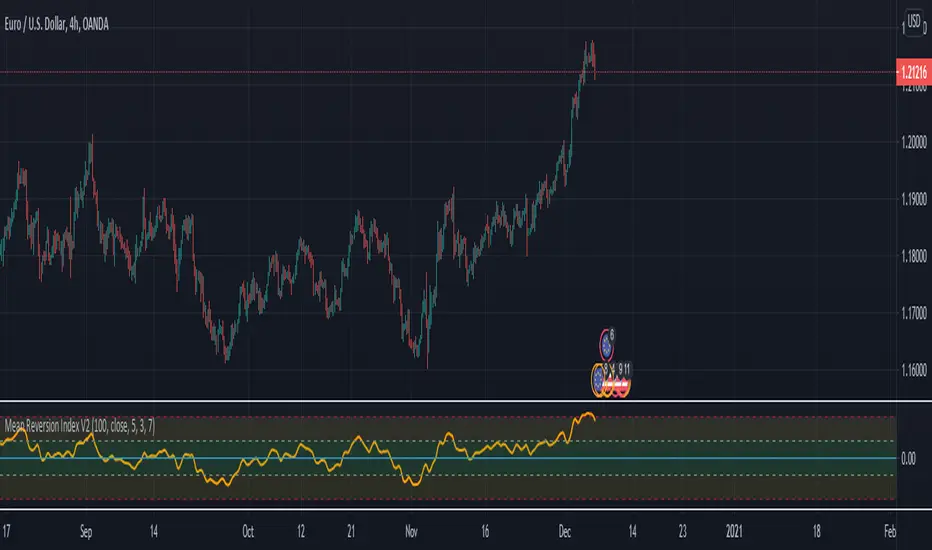
Indicator title : Mean Reversion Index
Description : This index is based on theory that suggests that asset prices and historical returns eventually will revert to the long-run mean or average level of the entire dataset.
Please note that this indicator are not intended to establish a trend bias. It only tells how far the closing price is from the mean price in terms of ATR multiples,
e.g. The green zone indicates that the price is within 3 ATR (default setting) from the mean price.
One way to use it is to determine a safe entry zone to enter current trend from a pullback.
For example, after a sharp retracement during an uptrend, as long as it does not retraced beyond the low of the green zone, Chances are, price is only retraced to its mean value and its not a start of a new downtrend and now ready to continue the uptrend.
More aggressive method to use this is as indicator approaching the higher limit of yellow zone,
prices is to far from the mean and not sustainable, and we can start to look for counter trend opportunity as price reverse to its mean value.
Disclaimer:
I always felt Pinescript is a very fast to type language with excellent visualization capabilities, so I've been using it as code-testing platform prior to actual coding in other platform.
Having said that, these study scripts was built only to test/visualize an idea to see its viability and if it can be used to optimize existing strategy.
While some of it are useful and most are useless, none of it should be use as main decision maker.
Indicator title : Mean Reversion Index
Description : This index is based on theory that suggests that asset prices and historical returns eventually will revert to the long-run mean or average level of the entire dataset.
Please note that this indicator are not intended to establish a trend bias. It only tells how far the closing price is from the mean price in terms of ATR multiples,
e.g. The green zone indicates that the price is within 3 ATR (default setting) from the mean price.
One way to use it is to determine a safe entry zone to enter current trend from a pullback.
For example, after a sharp retracement during an uptrend, as long as it does not retraced beyond the low of the green zone, Chances are, price is only retraced to its mean value and its not a start of a new downtrend and now ready to continue the uptrend.
More aggressive method to use this is as indicator approaching the higher limit of yellow zone,
prices is to far from the mean and not sustainable, and we can start to look for counter trend opportunity as price reverse to its mean value.
릴리즈 노트
- Improve smoothing method - Improve line display
- Added Sensitivity Option (High sensitivity will have more jagged line, and slightly faster reaction to price)
보호된 스크립트입니다
이 스크립트는 비공개 소스로 게시됩니다. 하지만 이를 자유롭게 제한 없이 사용할 수 있습니다 – 자세한 내용은 여기에서 확인하세요.
면책사항
해당 정보와 게시물은 금융, 투자, 트레이딩 또는 기타 유형의 조언이나 권장 사항으로 간주되지 않으며, 트레이딩뷰에서 제공하거나 보증하는 것이 아닙니다. 자세한 내용은 이용 약관을 참조하세요.
보호된 스크립트입니다
이 스크립트는 비공개 소스로 게시됩니다. 하지만 이를 자유롭게 제한 없이 사용할 수 있습니다 – 자세한 내용은 여기에서 확인하세요.
면책사항
해당 정보와 게시물은 금융, 투자, 트레이딩 또는 기타 유형의 조언이나 권장 사항으로 간주되지 않으며, 트레이딩뷰에서 제공하거나 보증하는 것이 아닙니다. 자세한 내용은 이용 약관을 참조하세요.