OPEN-SOURCE SCRIPT
업데이트됨 Crypto Tripple RSI

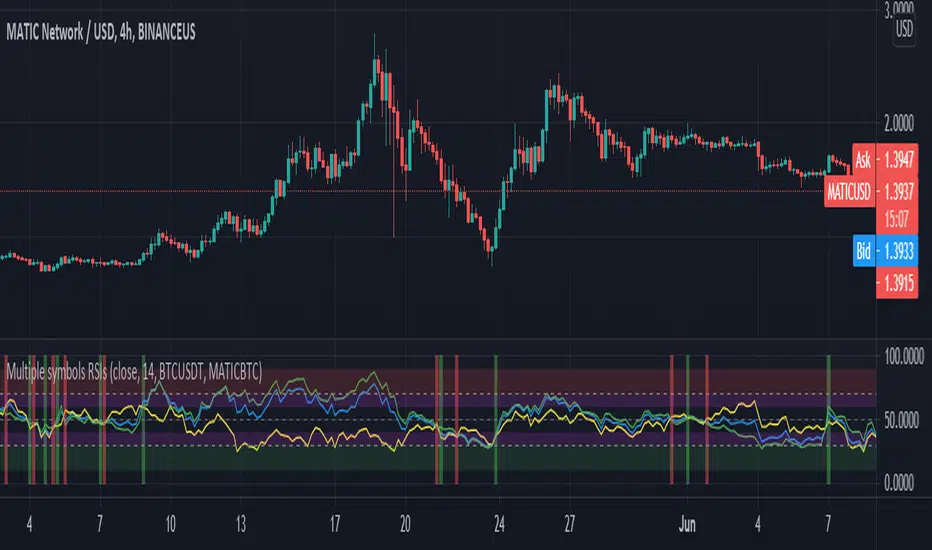
Gives an ability to compare 3 RSIs:
It helps to understand the cause of price change - whether BTC provokes price change or not. Also it shows performance of an altcoin - the bigger gaps between RSIs, the stronger (RSI of BTC is on the bottom)/ weaker (RSI of BTC is on the top) altcoin is.
- current altcoin + BTC (e.g. ADABTC) - green by default
- current pair (e.g. ADAUSDT) - blue by default
- BTC (e.g. BTCUSDT) - yellow by default
It helps to understand the cause of price change - whether BTC provokes price change or not. Also it shows performance of an altcoin - the bigger gaps between RSIs, the stronger (RSI of BTC is on the bottom)/ weaker (RSI of BTC is on the top) altcoin is.
릴리즈 노트
Just moved `transp` argument (obsolete soon) into `color.new`릴리즈 노트
- Add important levels (explanation link in the code)
- Add alerts
- Add markers, when X RSI crosses up or down BTC RSI
릴리즈 노트
Some cryptocurrencies has no pair with BTC which caused errors. I have added ability to choose second and third source of RSIs (formerly BTC RSI and X_BTC RSI). Besides the third RSI is hidden by default because there is no way to dynamically set third source in settings. But now it is universal and you can use it not only with cryptocurrencies :) 릴리즈 노트
- New levels: 80 and 20
- Additional lines: 75 and 25
- Ability to change resolution of #2 and #3 RSI
- Separate source and length for all RSIs
릴리즈 노트
- New RSI: "Additional current RSI" - to compare current RSI with different timeframe
오픈 소스 스크립트
트레이딩뷰의 진정한 정신에 따라, 이 스크립트의 작성자는 이를 오픈소스로 공개하여 트레이더들이 기능을 검토하고 검증할 수 있도록 했습니다. 작성자에게 찬사를 보냅니다! 이 코드는 무료로 사용할 수 있지만, 코드를 재게시하는 경우 하우스 룰이 적용된다는 점을 기억하세요.
면책사항
해당 정보와 게시물은 금융, 투자, 트레이딩 또는 기타 유형의 조언이나 권장 사항으로 간주되지 않으며, 트레이딩뷰에서 제공하거나 보증하는 것이 아닙니다. 자세한 내용은 이용 약관을 참조하세요.
오픈 소스 스크립트
트레이딩뷰의 진정한 정신에 따라, 이 스크립트의 작성자는 이를 오픈소스로 공개하여 트레이더들이 기능을 검토하고 검증할 수 있도록 했습니다. 작성자에게 찬사를 보냅니다! 이 코드는 무료로 사용할 수 있지만, 코드를 재게시하는 경우 하우스 룰이 적용된다는 점을 기억하세요.
면책사항
해당 정보와 게시물은 금융, 투자, 트레이딩 또는 기타 유형의 조언이나 권장 사항으로 간주되지 않으며, 트레이딩뷰에서 제공하거나 보증하는 것이 아닙니다. 자세한 내용은 이용 약관을 참조하세요.