OPEN-SOURCE SCRIPT
Smoothed Basis
Overview and Purpose
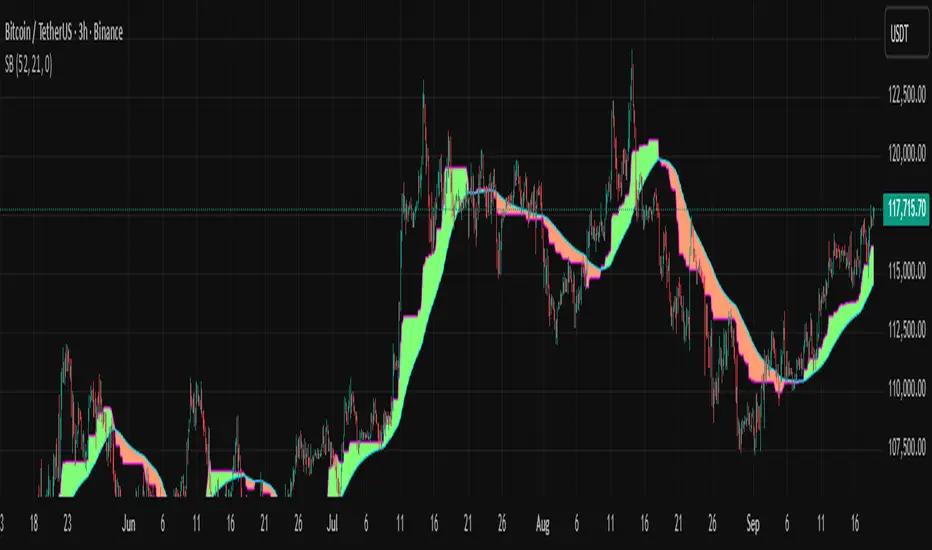
The script calculates a smoothed mid-range basis between the highest and lowest prices over a specified period, then applies a smoothing function (smoothed moving average) to show the trend direction or momentum in a less noisy way. The area between the basis and its smoothed value is color-filled to visually highlight when the basis is above or below the smoothed average, signaling potentially bullish or bearish momentum.
Indicator Setup
length = Period length for calculating the highest and lowest values.
signal = Smoothing period used to smooth the basis.
offset =Optional horizontal shift to the plots (default 0).
Core Calculations
lower = Finds the lowest low over the past length bars.
upper = Finds the highest high over the past length bars.
basis = Calculates the midpoint between the highest and lowest.
Smoothing Calculation (Smoothed Moving Average - SMMA)
Declares smma as 0.0 initially. If the previous smma value is not available (like on the first bar), initializes with a simple moving average of basis over signal bars. Else applies formula
which gives a smoother version of basis which reacts less to sudden changes.
Plotting and Color Fill
Plots the raw basis line and smoothed basis line .
Fills the area between the basis and smoothed basis lines:
Greenish fill if the basis is above the smoothed value (potentially bullish).
Reddish fill if the basis is below the smoothed value (potentially bearish).
Interpretation and Use
The indicator visually shows where price ranges are shifting by tracking the midpoint between recent highs and lows.
The smoothed basis serves as a trend or momentum filter by dampening noise in the basis line.
When the basis is above the smoothed line (green fill), it signals upward momentum or strength; below it (red fill) suggests downward momentum or weakness.
The length and signal parameters allow tuning for different timeframes or asset volatility.
In summary, this code creates a custom smoothed oscillator based on the midpoint range of price extremes, highlighting trend changes via color fills and smoothening price action noise with an SMMA.
오픈 소스 스크립트
트레이딩뷰의 진정한 정신에 따라, 이 스크립트의 작성자는 이를 오픈소스로 공개하여 트레이더들이 기능을 검토하고 검증할 수 있도록 했습니다. 작성자에게 찬사를 보냅니다! 이 코드는 무료로 사용할 수 있지만, 코드를 재게시하는 경우 하우스 룰이 적용된다는 점을 기억하세요.
면책사항
해당 정보와 게시물은 금융, 투자, 트레이딩 또는 기타 유형의 조언이나 권장 사항으로 간주되지 않으며, 트레이딩뷰에서 제공하거나 보증하는 것이 아닙니다. 자세한 내용은 이용 약관을 참조하세요.
오픈 소스 스크립트
트레이딩뷰의 진정한 정신에 따라, 이 스크립트의 작성자는 이를 오픈소스로 공개하여 트레이더들이 기능을 검토하고 검증할 수 있도록 했습니다. 작성자에게 찬사를 보냅니다! 이 코드는 무료로 사용할 수 있지만, 코드를 재게시하는 경우 하우스 룰이 적용된다는 점을 기억하세요.
면책사항
해당 정보와 게시물은 금융, 투자, 트레이딩 또는 기타 유형의 조언이나 권장 사항으로 간주되지 않으며, 트레이딩뷰에서 제공하거나 보증하는 것이 아닙니다. 자세한 내용은 이용 약관을 참조하세요.