OPEN-SOURCE SCRIPT
업데이트됨 Interquartile range
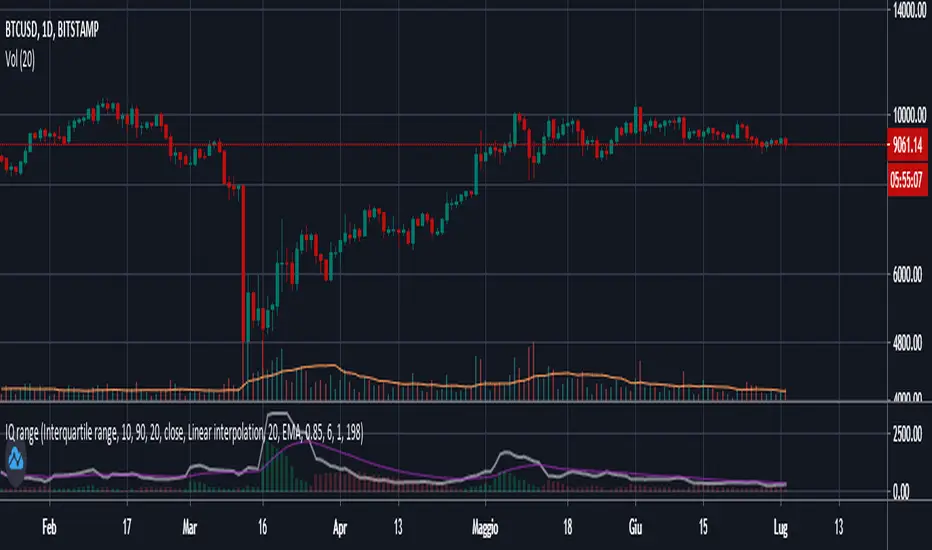
This script plots the Interquartile range (difference between 3rd and 1st quartile), providing useful infos about price distribution and volatility . It is designed to work paired with my other script "Moving percentiles channel", but you can also use it alone.
Features:
- You can compute the percentiles using Linear interpolation or Nearest Rank methods
- You can plot not only the Interquartile range, but also the range (difference between 100th and 0 percentiles) or a User defined range (you have to select which percentiles you want to use from the settings)
- The script also plots a signal line that you can use to obtain signals when the Range line crosses the signal line itself. You can plot the signal line using many different MAs ( SMA , EMA , DEMA , TEMA , WMA , VWMA , HMA , ALMA , LSMA , FRAMA ).
- It also plots an histogram that represents the difference between the Range and the Signal line. It will be green colored when positive, and red colored when negative.
Please show me your support and follow me if you like my scripts. Many more of them are coming in the future.
@ Bezzus
릴리즈 노트
Updates:- Removed unnecessary code lines.
Bezzus
오픈 소스 스크립트
트레이딩뷰의 진정한 정신에 따라, 이 스크립트의 작성자는 이를 오픈소스로 공개하여 트레이더들이 기능을 검토하고 검증할 수 있도록 했습니다. 작성자에게 찬사를 보냅니다! 이 코드는 무료로 사용할 수 있지만, 코드를 재게시하는 경우 하우스 룰이 적용된다는 점을 기억하세요.
면책사항
해당 정보와 게시물은 금융, 투자, 트레이딩 또는 기타 유형의 조언이나 권장 사항으로 간주되지 않으며, 트레이딩뷰에서 제공하거나 보증하는 것이 아닙니다. 자세한 내용은 이용 약관을 참조하세요.
오픈 소스 스크립트
트레이딩뷰의 진정한 정신에 따라, 이 스크립트의 작성자는 이를 오픈소스로 공개하여 트레이더들이 기능을 검토하고 검증할 수 있도록 했습니다. 작성자에게 찬사를 보냅니다! 이 코드는 무료로 사용할 수 있지만, 코드를 재게시하는 경우 하우스 룰이 적용된다는 점을 기억하세요.
면책사항
해당 정보와 게시물은 금융, 투자, 트레이딩 또는 기타 유형의 조언이나 권장 사항으로 간주되지 않으며, 트레이딩뷰에서 제공하거나 보증하는 것이 아닙니다. 자세한 내용은 이용 약관을 참조하세요.