OPEN-SOURCE SCRIPT
Ease of Movement Z-Score Trend | Dextra
General Description:
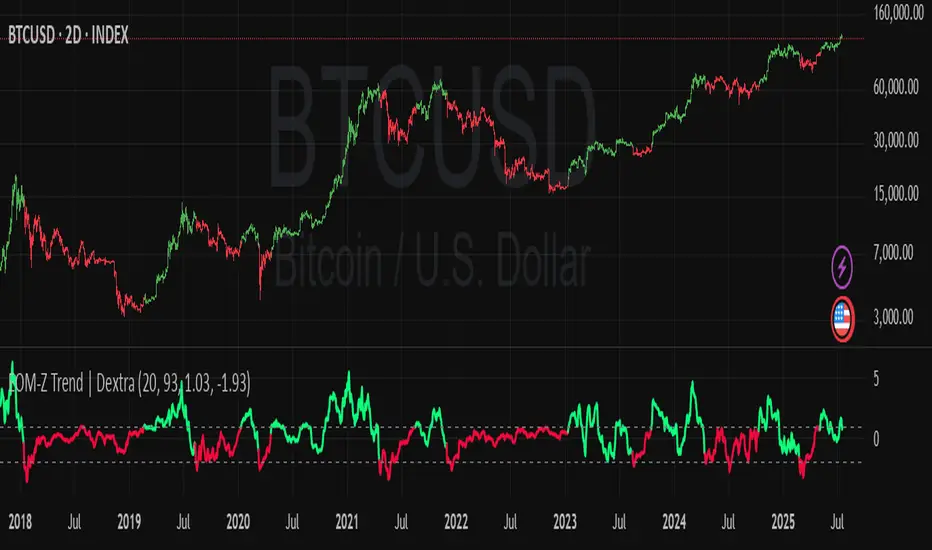
The "Ease of Movement Z-Score Trend | Dextra" (EOM-Z Trend) is an innovative technical analysis tool that combines the Ease of Movement (EOM) concept with Z-Score to measure how easily price moves relative to volume, while identifying market trends with intuitive visualization. This indicator is designed to help traders detect uptrend and downtrend phases with precision, enhanced by candle coloring for direct trend representation on the chart.
Key Features
Ease of Movement (EOM): Measures how easily price moves based on the change in the midpoint price and volume, normalized with Z-Score for statistical analysis.
Z-Score Normalization: Provides an indication of deviations from the mean, enabling the identification of overbought or oversold conditions.
Adjustable Thresholds: Users can customize upper and lower thresholds to define trend boundaries.
Candle Coloring: Visual trend representation with green (uptrend), red (downtrend), and gray (neutral) candles.
Flexibility: Adjustable for different timeframes and assets.
How It Works
The indicator operates through the following steps:
EOM Calculation:
hl2 = (high + low) / 2: Calculates the average midpoint price per bar.
eom = ta.sma(10000 * ta.change(hl2) * (high - low) / volume, length): EOM is computed as the smoothed average of the price midpoint change multiplied by the price range per unit volume, scaled by 10,000, over length bars (default 20).
Z-Score Calculation:
mean_eom = ta.sma(eom, z_length): Average EOM over z_length bars (default 93).
std_dev_eom = ta.stdev(eom, z_length): Standard deviation of EOM.
z_score = (eom - mean_eom) / std_dev_eom: Z-Score indicating how far EOM deviates from its mean in standard deviation units.
Trend Detection:
upperthreshold (default 1.03) and lowerthreshold (default -1.63): Thresholds to classify uptrend (if Z-Score > upperthreshold) and downtrend (if Z-Score < lowerthreshold).
eom_is_up and eom_is_down: Logical variables for trend status.
Visualization:
plot(z_score, ...): Z-Score line plotted with green (uptrend), red (downtrend), or gray (neutral) coloring.
plotcandle(...): Candles colored green, red, or gray based on trend.
hline(...): Dashed lines marking the thresholds.
Input Settings
EOM Length (default 20): Period for calculating EOM, determining sensitivity to price changes.
Z-Score Lookback Period (default 93): Period for calculating the Z-Score mean and standard deviation.
Uptrend Threshold (default 1.03): Minimum Z-Score value to classify an uptrend.
Downtrend Threshold (default -1.93): Maximum Z-Score value to classify a downtrend.
How to Use
Installation: Add the indicator via the "Indicators" menu in TradingView and search for "EOM-Z Trend | Dextra".
Customization:
Adjust EOM Length and Z-Score Lookback Period based on the timeframe (e.g., 20 and 93 for daily timeframes).
Set Uptrend Threshold and Downtrend Threshold according to preference or asset characteristics (e.g., lower to 0.8 and -1.5 for volatile markets).
Interpretation:
Uptrend (Green): Z-Score above upperthreshold, indicating strong upward price movement.
Downtrend (Red): Z-Score below lowerthreshold, indicating significant downward movement.
Neutral (Gray): Conditions between thresholds, suggesting a sideways market.
Use candle coloring as the primary visual guide, combined with the Z-Score line for confirmation.
Advantages
Intuitive Visualization: Candle coloring simplifies trend identification without deep analysis.
Flexibility: Customizable parameters allow adaptation to various markets.
Statistical Analysis: Z-Score provides a robust perspective on price deviations from the norm.
No Repainting: The indicator uses historical data and does not alter values after a bar closes.
Limitations
Volume Dependency: Requires accurate volume data; an error occurs if volume is unavailable.
Market Context: Effectiveness depends on properly tuned thresholds for specific assets.
Lack of Additional Signals: No built-in alerts or supplementary confirmation indicators.
Recommendations
Ideal Timeframe: Daily (1D) or (2D) for stable trends.
Combination: Pair with others indicators for signal validation.
Optimization: Test thresholds on historical data of the traded asset for optimal results.
Important Notes
This indicator relies entirely on internal TradingView data (high, low, close, volume) and does not integrate on-chain data. Ensure your data provider supports volume to avoid errors. This version (1.0) is the initial release, with potential future updates including features like alerts or multi-timeframe analysis.
오픈 소스 스크립트
트레이딩뷰의 진정한 정신에 따라, 이 스크립트의 작성자는 이를 오픈소스로 공개하여 트레이더들이 기능을 검토하고 검증할 수 있도록 했습니다. 작성자에게 찬사를 보냅니다! 이 코드는 무료로 사용할 수 있지만, 코드를 재게시하는 경우 하우스 룰이 적용된다는 점을 기억하세요.
면책사항
해당 정보와 게시물은 금융, 투자, 트레이딩 또는 기타 유형의 조언이나 권장 사항으로 간주되지 않으며, 트레이딩뷰에서 제공하거나 보증하는 것이 아닙니다. 자세한 내용은 이용 약관을 참조하세요.
오픈 소스 스크립트
트레이딩뷰의 진정한 정신에 따라, 이 스크립트의 작성자는 이를 오픈소스로 공개하여 트레이더들이 기능을 검토하고 검증할 수 있도록 했습니다. 작성자에게 찬사를 보냅니다! 이 코드는 무료로 사용할 수 있지만, 코드를 재게시하는 경우 하우스 룰이 적용된다는 점을 기억하세요.
면책사항
해당 정보와 게시물은 금융, 투자, 트레이딩 또는 기타 유형의 조언이나 권장 사항으로 간주되지 않으며, 트레이딩뷰에서 제공하거나 보증하는 것이 아닙니다. 자세한 내용은 이용 약관을 참조하세요.