OPEN-SOURCE SCRIPT
Dollar Volume Ownership Gauge
Dollar Volume Ownership Gauge (DVOG)
By: Mando4_27
Version: 1.0 — Pine Script® v6
Overview
The Dollar Volume Ownership Gauge (DVOG) is designed to measure the intensity of real money participation behind each price bar.
Instead of tracking raw share volume, this tool converts every bar’s trading activity into dollar volume (price × volume) and highlights the transition points where institutional capital begins to take control of a move.
DVOG’s mission is simple:
Show when the crowd is trading vs. when the institutions are buying control.
Core Concept
Most retail traders focus on share count (volume) — but institutions think in dollar exposure.
A small-cap printing a 1-million-share candle at $1 is very different from a 1-million-share candle at $10.
DVOG normalizes this by displaying total traded dollar value per bar, then color-codes and alerts when the volume of money crosses key thresholds.
This exposes the exact moments when ownership is shifting — often before major breakouts, reclaims, or exhaustion reversals.
How It Works
Dollar Volume Calculation
Each candle’s dollar volume is computed as close × volume.
Data is aggregated from the 5-minute timeframe regardless of your current chart, allowing consistent institutional-flow detection on any resolution.
Threshold Logic
Two customizable levels define interest zones:
$500K Threshold → Early or moderate institutional attention.
$1M Threshold → High-conviction or aggressive accumulation.
Both levels can be edited to fit different market caps or trading styles.
Bar Coloring Scheme
Red = Dollar Volume ≥ $1,000,000 → Significant institutional activity / control bar.
Green = Dollar Volume ≥ $500,000 and < $1,000,000 → Emerging accumulation / transition bar.
Black = Below $500,000 → Retail or low-interest zone.
(Colors are intentionally inverted from standard expectation: when volume intensity spikes, the bar turns hotter in tone.)
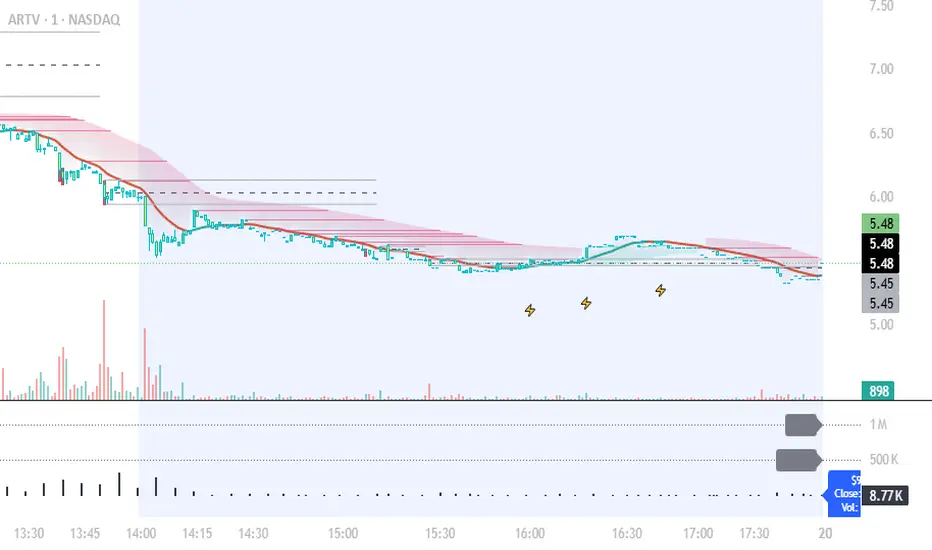
Plot Display
Histogram style plot displays 5-minute aggregated dollar volume per bar.
Dotted reference lines mark $500K and $1M levels, with live right-hand labels for quick reading.
Optional debug label shows current bar’s dollar value, closing price, and raw volume for transparency.
Alerts & Conditions
DVOG includes three alert triggers for hands-off monitoring:
Alert Name Trigger Message Purpose
Green Bar Alert – Dollar Volume ≥ $500K When dollar volume first crosses $500K “Institutional interest starting on [Ticker]” Signals early money entering.
Dollar Volume ≥ $500K Same as above, configurable “Early institutional interest detected…” Broad alert option.
Dollar Volume ≥ $1M When dollar volume first crosses $1M “Significant money flow detected…” Indicates heavy institutional presence or ignition bar.
You can enable or disable alerts via checkbox inputs, allowing you to monitor just the levels that fit your style.
Interpretation & Use Cases
Identify Institutional “Ignition” Points:
Watch for sudden green or red DVOG bars after long low-volume consolidation — these often precede explosive continuation moves.
Confirm Breakouts & Reclaims:
If price reclaims a key level (HOD, neckline, or coil top) and DVOG flashes green/red, odds strongly favor follow-through.
Spot Trap Exhaustion:
After a flush or low-volume fade, the first strong green/red DVOG bar can mark the institutional reclaim — the moment retail control ends.
Filter Noise:
Ignore standard volume spikes. DVOG only reacts when dollar ownership materially changes hands, not when small traders churn shares.
Customization
Setting Default Description
$500K Threshold 500,000 Lower limit for “Green” institutional attention.
$1M Threshold 1,000,000 Upper limit for “Red” heavy institutional control.
Show Alerts ✅ Enable or disable global alerts.
Alert on Green Bars ✅ Toggle only the $500K crossover alerts.
Adjust thresholds to match the liquidity of your preferred tickers — for example, micro-caps may use $100K/$300K, while large-caps might use $5M/$20M.
Reading the Output
Black baseline = Noise / retail chop.
First Green bar = Smart money starts building position.
Red bar(s) = Ownership shift confirmed — institutions active.
Flat-to-rising pattern in DVOG = Sustained accumulation; often aligns with strong trend continuation.
Summary
DVOG transforms raw volume into actionable context — showing you when capital, not hype, is moving.
It’s particularly effective for:
Momentum and breakout traders
Liquidity trap reclaims (Kuiper-style setups)
Identifying early ignition bars before halts
Confirming frontside strength in micro-caps
Use DVOG as your ownership radar — the visual cue for when the market stops being retail and starts being real.
By: Mando4_27
Version: 1.0 — Pine Script® v6
Overview
The Dollar Volume Ownership Gauge (DVOG) is designed to measure the intensity of real money participation behind each price bar.
Instead of tracking raw share volume, this tool converts every bar’s trading activity into dollar volume (price × volume) and highlights the transition points where institutional capital begins to take control of a move.
DVOG’s mission is simple:
Show when the crowd is trading vs. when the institutions are buying control.
Core Concept
Most retail traders focus on share count (volume) — but institutions think in dollar exposure.
A small-cap printing a 1-million-share candle at $1 is very different from a 1-million-share candle at $10.
DVOG normalizes this by displaying total traded dollar value per bar, then color-codes and alerts when the volume of money crosses key thresholds.
This exposes the exact moments when ownership is shifting — often before major breakouts, reclaims, or exhaustion reversals.
How It Works
Dollar Volume Calculation
Each candle’s dollar volume is computed as close × volume.
Data is aggregated from the 5-minute timeframe regardless of your current chart, allowing consistent institutional-flow detection on any resolution.
Threshold Logic
Two customizable levels define interest zones:
$500K Threshold → Early or moderate institutional attention.
$1M Threshold → High-conviction or aggressive accumulation.
Both levels can be edited to fit different market caps or trading styles.
Bar Coloring Scheme
Red = Dollar Volume ≥ $1,000,000 → Significant institutional activity / control bar.
Green = Dollar Volume ≥ $500,000 and < $1,000,000 → Emerging accumulation / transition bar.
Black = Below $500,000 → Retail or low-interest zone.
(Colors are intentionally inverted from standard expectation: when volume intensity spikes, the bar turns hotter in tone.)
Plot Display
Histogram style plot displays 5-minute aggregated dollar volume per bar.
Dotted reference lines mark $500K and $1M levels, with live right-hand labels for quick reading.
Optional debug label shows current bar’s dollar value, closing price, and raw volume for transparency.
Alerts & Conditions
DVOG includes three alert triggers for hands-off monitoring:
Alert Name Trigger Message Purpose
Green Bar Alert – Dollar Volume ≥ $500K When dollar volume first crosses $500K “Institutional interest starting on [Ticker]” Signals early money entering.
Dollar Volume ≥ $500K Same as above, configurable “Early institutional interest detected…” Broad alert option.
Dollar Volume ≥ $1M When dollar volume first crosses $1M “Significant money flow detected…” Indicates heavy institutional presence or ignition bar.
You can enable or disable alerts via checkbox inputs, allowing you to monitor just the levels that fit your style.
Interpretation & Use Cases
Identify Institutional “Ignition” Points:
Watch for sudden green or red DVOG bars after long low-volume consolidation — these often precede explosive continuation moves.
Confirm Breakouts & Reclaims:
If price reclaims a key level (HOD, neckline, or coil top) and DVOG flashes green/red, odds strongly favor follow-through.
Spot Trap Exhaustion:
After a flush or low-volume fade, the first strong green/red DVOG bar can mark the institutional reclaim — the moment retail control ends.
Filter Noise:
Ignore standard volume spikes. DVOG only reacts when dollar ownership materially changes hands, not when small traders churn shares.
Customization
Setting Default Description
$500K Threshold 500,000 Lower limit for “Green” institutional attention.
$1M Threshold 1,000,000 Upper limit for “Red” heavy institutional control.
Show Alerts ✅ Enable or disable global alerts.
Alert on Green Bars ✅ Toggle only the $500K crossover alerts.
Adjust thresholds to match the liquidity of your preferred tickers — for example, micro-caps may use $100K/$300K, while large-caps might use $5M/$20M.
Reading the Output
Black baseline = Noise / retail chop.
First Green bar = Smart money starts building position.
Red bar(s) = Ownership shift confirmed — institutions active.
Flat-to-rising pattern in DVOG = Sustained accumulation; often aligns with strong trend continuation.
Summary
DVOG transforms raw volume into actionable context — showing you when capital, not hype, is moving.
It’s particularly effective for:
Momentum and breakout traders
Liquidity trap reclaims (Kuiper-style setups)
Identifying early ignition bars before halts
Confirming frontside strength in micro-caps
Use DVOG as your ownership radar — the visual cue for when the market stops being retail and starts being real.
오픈 소스 스크립트
트레이딩뷰의 진정한 정신에 따라, 이 스크립트의 작성자는 이를 오픈소스로 공개하여 트레이더들이 기능을 검토하고 검증할 수 있도록 했습니다. 작성자에게 찬사를 보냅니다! 이 코드는 무료로 사용할 수 있지만, 코드를 재게시하는 경우 하우스 룰이 적용된다는 점을 기억하세요.
면책사항
해당 정보와 게시물은 금융, 투자, 트레이딩 또는 기타 유형의 조언이나 권장 사항으로 간주되지 않으며, 트레이딩뷰에서 제공하거나 보증하는 것이 아닙니다. 자세한 내용은 이용 약관을 참조하세요.
오픈 소스 스크립트
트레이딩뷰의 진정한 정신에 따라, 이 스크립트의 작성자는 이를 오픈소스로 공개하여 트레이더들이 기능을 검토하고 검증할 수 있도록 했습니다. 작성자에게 찬사를 보냅니다! 이 코드는 무료로 사용할 수 있지만, 코드를 재게시하는 경우 하우스 룰이 적용된다는 점을 기억하세요.
면책사항
해당 정보와 게시물은 금융, 투자, 트레이딩 또는 기타 유형의 조언이나 권장 사항으로 간주되지 않으며, 트레이딩뷰에서 제공하거나 보증하는 것이 아닙니다. 자세한 내용은 이용 약관을 참조하세요.