PROTECTED SOURCE SCRIPT
Daily Manual KILLZONES
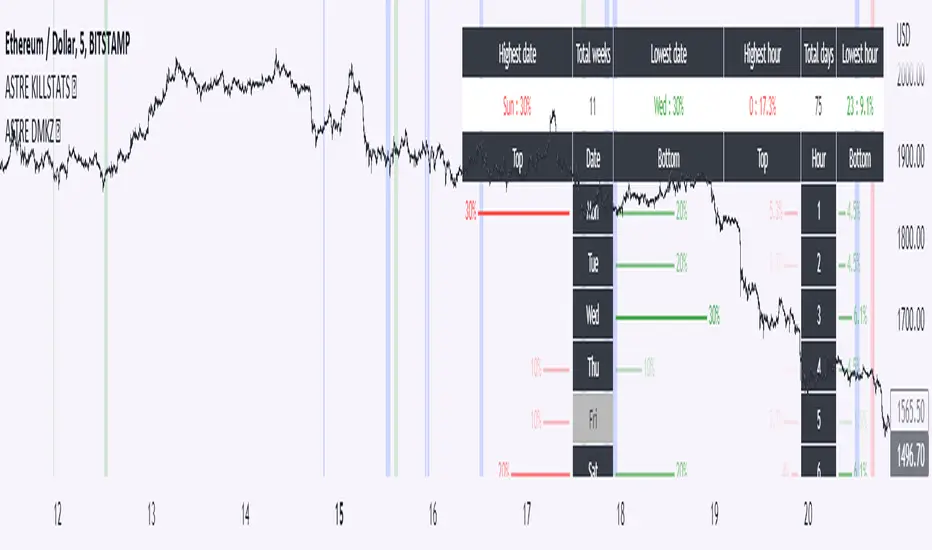
This indicator is to be used with "KILLSTATS", our indicator allowing to backtest on hundreds of days at which time, and which day the top/low of the day and week is formed.

"Manual Killzone" allows to define our statistical killzones by day of the week manually: you define your own rules according to your interpretation of our Killstats indicator.
It integrates a daily price action filter according to the ICT concept:
It will only display bullish probabilities (green) defined if and only if we are in discount and out of the daily range 25/75%.
Same for bearish probabilities (red)
The blue color is to be applied in case of reversal with high contradictory probability (Example: to be used for Tuesday from 2pm to 3pm, if Tuesday is a day with high probability to form a top, but 2pm/15pm is the time with high probability to form a bottom AND a top. Indecision => blue)
WARNING : Calculated according to Etc/UTC time : put "0" in the Timezone parameter of killstats.
It is necessary to use the replay mode regularly during the backtesting to update the data!
보호된 스크립트입니다
이 스크립트는 비공개 소스로 게시됩니다. 하지만 이를 자유롭게 제한 없이 사용할 수 있습니다 – 자세한 내용은 여기에서 확인하세요.
Most aggressive TradingView/MT4/MT5 trading setup on the market. Pure juice concentrated from SMC/ICT, divergences and PA!
Snipe the institutional levels! 🐋🏹
Snipe the institutional levels! 🐋🏹
면책사항
해당 정보와 게시물은 금융, 투자, 트레이딩 또는 기타 유형의 조언이나 권장 사항으로 간주되지 않으며, 트레이딩뷰에서 제공하거나 보증하는 것이 아닙니다. 자세한 내용은 이용 약관을 참조하세요.