OPEN-SOURCE SCRIPT
Automatic Fibonacci retracement based on the highest high and lo
The chart is fractal, meaning that what happens can always be broken down into smaller portions.
This is often seen in various AR (Algorithmic Rules) concepts, such as breakers, order blocks, etc., where the price reacts.
I’ve visualized this behavior with this indicator.
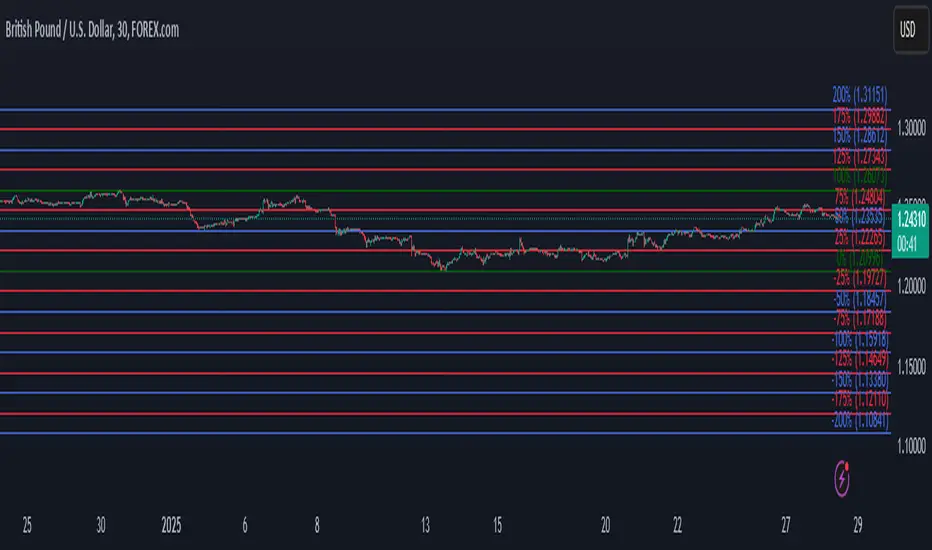
This indicator takes the highest high and the lowest low from the past 5 weeks, excluding the current week.
The lowest low will represent 0%, and the highest high will represent 100% (green lines).
It then divides this range into 25%, 50%, 75%, and 100% levels (red and blue lines).
The indicator works on all charts and all timeframes, automatically adjusting when you switch charts or timeframes. No manual input is required.
Additionally, above 100%, it will create levels at 125%, 150%, 175%, and 200%, while below 0%, it will create levels at -25%, -50%, -75%, and -100%.
Your chart will now be divided into these 25% levels, allowing you to observe how the price either respects or breaks through them.
Again, this isn’t something “groundbreaking,” but simply a visual aid to identify levels where the price finds support/resistance or breaks through.
It helps me gain a broader perspective and determine whether my trade is moving in the right direction or if I should remain cautious.
This is often seen in various AR (Algorithmic Rules) concepts, such as breakers, order blocks, etc., where the price reacts.
I’ve visualized this behavior with this indicator.
This indicator takes the highest high and the lowest low from the past 5 weeks, excluding the current week.
The lowest low will represent 0%, and the highest high will represent 100% (green lines).
It then divides this range into 25%, 50%, 75%, and 100% levels (red and blue lines).
The indicator works on all charts and all timeframes, automatically adjusting when you switch charts or timeframes. No manual input is required.
Additionally, above 100%, it will create levels at 125%, 150%, 175%, and 200%, while below 0%, it will create levels at -25%, -50%, -75%, and -100%.
Your chart will now be divided into these 25% levels, allowing you to observe how the price either respects or breaks through them.
Again, this isn’t something “groundbreaking,” but simply a visual aid to identify levels where the price finds support/resistance or breaks through.
It helps me gain a broader perspective and determine whether my trade is moving in the right direction or if I should remain cautious.
오픈 소스 스크립트
트레이딩뷰의 진정한 정신에 따라, 이 스크립트의 작성자는 이를 오픈소스로 공개하여 트레이더들이 기능을 검토하고 검증할 수 있도록 했습니다. 작성자에게 찬사를 보냅니다! 이 코드는 무료로 사용할 수 있지만, 코드를 재게시하는 경우 하우스 룰이 적용된다는 점을 기억하세요.
면책사항
해당 정보와 게시물은 금융, 투자, 트레이딩 또는 기타 유형의 조언이나 권장 사항으로 간주되지 않으며, 트레이딩뷰에서 제공하거나 보증하는 것이 아닙니다. 자세한 내용은 이용 약관을 참조하세요.
오픈 소스 스크립트
트레이딩뷰의 진정한 정신에 따라, 이 스크립트의 작성자는 이를 오픈소스로 공개하여 트레이더들이 기능을 검토하고 검증할 수 있도록 했습니다. 작성자에게 찬사를 보냅니다! 이 코드는 무료로 사용할 수 있지만, 코드를 재게시하는 경우 하우스 룰이 적용된다는 점을 기억하세요.
면책사항
해당 정보와 게시물은 금융, 투자, 트레이딩 또는 기타 유형의 조언이나 권장 사항으로 간주되지 않으며, 트레이딩뷰에서 제공하거나 보증하는 것이 아닙니다. 자세한 내용은 이용 약관을 참조하세요.