PROTECTED SOURCE SCRIPT
EMAS Signal DX
Hello all,
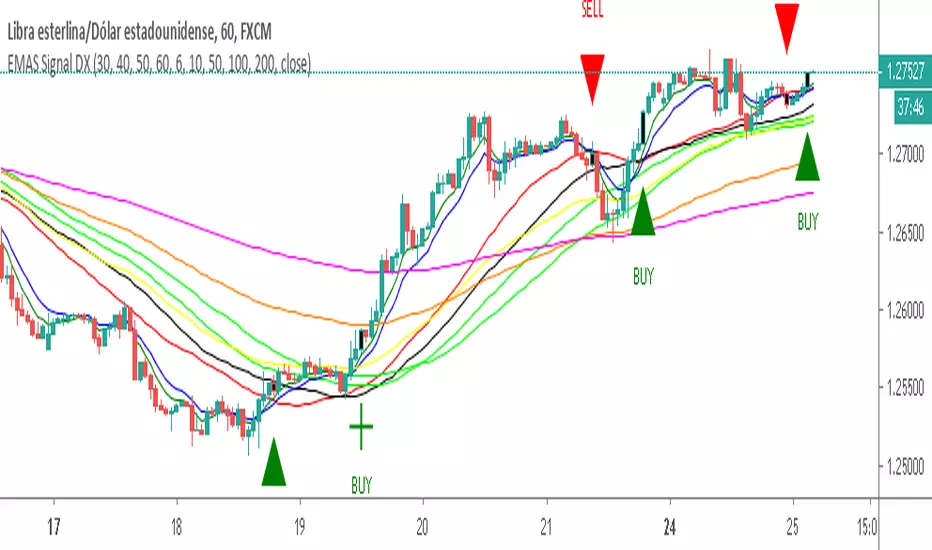
Vs2 of EMAS Signal Double Cross indicator that plots 5 EMA lines and 4 SMA .
Features:
-Signals are represented visually as a triangle on the chart.
-Also represented visually as bar color on the chart.
-When SMA and EMA 1 cross - a Long signal is called if SMA cross above EMA 1, a short if the cross is below EMA 1.
-When EMA 2 and EMA 3 cross - a Long signal is called if EMA 2 cross above EMA 3, a short if the cross is below EMA 3.
-You can activate and deactivate the triangles and the color of the bars.
That’s it, happy pips!
보호된 스크립트입니다
이 스크립트는 비공개 소스로 게시됩니다. 하지만 이를 자유롭게 제한 없이 사용할 수 있습니다 – 자세한 내용은 여기에서 확인하세요.
면책사항
해당 정보와 게시물은 금융, 투자, 트레이딩 또는 기타 유형의 조언이나 권장 사항으로 간주되지 않으며, 트레이딩뷰에서 제공하거나 보증하는 것이 아닙니다. 자세한 내용은 이용 약관을 참조하세요.
면책사항
해당 정보와 게시물은 금융, 투자, 트레이딩 또는 기타 유형의 조언이나 권장 사항으로 간주되지 않으며, 트레이딩뷰에서 제공하거나 보증하는 것이 아닙니다. 자세한 내용은 이용 약관을 참조하세요.