OPEN-SOURCE SCRIPT
업데이트됨 Simple Sessions
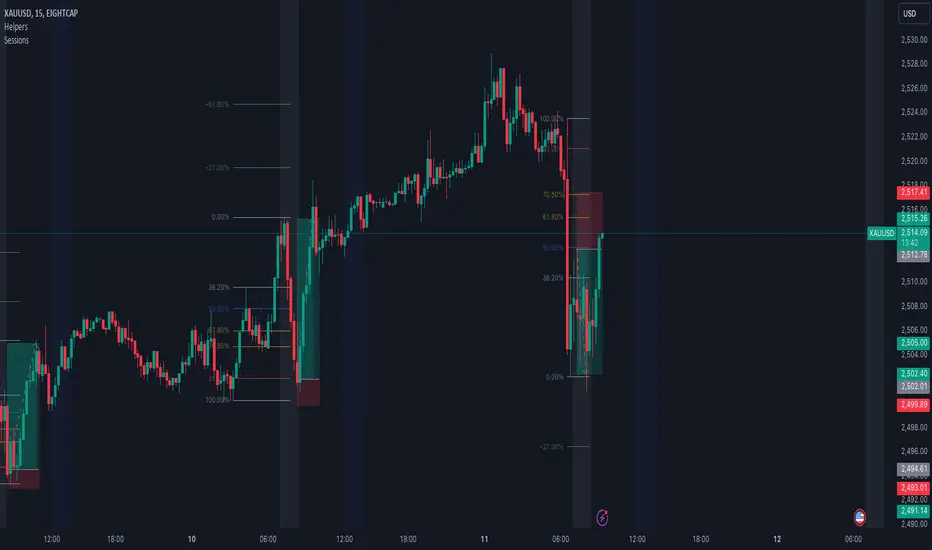
This is a simple sessions indicator that allows you to highlight up to 3 different sessions on your chart. This is intended for charts in any timeframe lower than the Daily timeframe. Really simple, clean, and minimalistic on purpose, intended to help and not clutter the chart.
Options/parameters:
Options/parameters:
- Sessions: Check and setup beginning and end of the sessions. Up to 3 sessions at the same time.
- Enable specific timezone: You can specify your exact timezone so that the sessions stay consistent even when you’re viewing different assets from different brokers that might be providing the price data in different timezones.
- Show next day: Check to allow for your sessions to be viewed in advance for the following day so that you can expect your trading session in the chart (something simple, but quite useful).
- Show next day input also accepts an integer value (default at 0). This numeric value is useful only for a few different assets that don’t have price data (aren’t tradable) 24 hours of each week-day. When that’s the case the calculation to show the session in the future day is not precise so with this number you can adjust it. For example, on
 SPX500USD in the 30m time-frame, between 5pm and 6pm NY time there’s no price data. If you check that chart on any day at 4:30pm NY time, the next bar should be at 5pm, however since there’s no data it jumps to 6pm NY time. For that example you can set the input number to -2 and it will move the sessions to the correct time window you specified in the Sessions input.
 - Optional comment: This is a comment that will be shown in the status line. There’s no other use for this. It’s only helpful when you have multiple instances of the indicator for different assets for example. In that case with this comment you would be able to instantly detect which indicator is for which chart.
릴리즈 노트
This is a simple sessions indicator that allows you to highlight up to 3 different sessions on your chart. This is intended for charts in any timeframe lower than the Daily timeframe. Really simple, clean, and minimalistic on purpose, intended to help and not clutter the chart.Options/parameters:
- Sessions: Check and setup beginning and end of the sessions. Up to 3 sessions at the same time.
- Enable specific timezone: You can specify your exact timezone so that the sessions stay consistent even when you’re viewing different assets from different brokers that might be providing the price data in different timezones.
- Show next day: Check to allow for your sessions to be viewed in advance for the following day so that you can expect your trading session in the chart (something simple, but quite useful).
- Optional comment: This is a comment that will be shown in the status line. There’s no other use for this. It’s only helpful when you have multiple instances of the indicator for different assets for example. In that case with this comment you would be able to instantly detect which indicator is for which chart.
Notes on showing the next day's session:
In the previous version I was calculating the number of seconds in a day and dividing that by the number of seconds of the chart's timeframe to calculate how many bars there were in a day for the current asset. However this turned to be imprecise for a few different assets that don’t have price data (aren’t tradable) 24 hours of each week-day (such as the
tfInSeconds = timeframe.in_seconds(timeframe.period)
dayInSeconds = timeframe.in_seconds("1D")
barsOffset = (tfInSeconds < dayInSeconds and i_shouldOffset) ? (dayInSeconds / tfInSeconds) + i_additionalOffset : 0
To solve this problem in a better way, with this release, I'm calculating the bars between each session every day and using that amount to offset.
isFirstSessionCandle = i_plotSession1 ? inSession1 and not(inSession1[1]) :
i_plotSession2 ? inSession2 and not(inSession2[1]) :
i_plotSession3 ? inSession3 and not(inSession3[1]) : false
firstCandleIndex = ta.barssince(isFirstSessionCandle)
barsBetweenLastSession = firstCandleIndex > firstCandleIndex[1] ? firstCandleIndex : firstCandleIndex[1]
var int barsBetweenSession = na
if na(barsBetweenSession) or firstCandleIndex > barsBetweenSession
barsBetweenSession := firstCandleIndex
if isFirstSessionCandle and barsBetweenLastSession > firstCandleIndex
barsBetweenSession := barsBetweenLastSession
barsAhead = i_shouldOffset ? barsBetweenSession + 1 : 0
This method might still be not 100% precise when there's missing price data randomly in a single day for whatever reason, but it will be fixed in the following day. I haven't experienced this issue, it's just a possibility that came to my mind. This solution is better than the previous one as it will now calculate much more precisely the bars between the sessions and offset correctly in 99% of the times to show the following day's session so you can expect it.
Small downside: the resulting value of
barsAhead
오픈 소스 스크립트
트레이딩뷰의 진정한 정신에 따라, 이 스크립트의 작성자는 이를 오픈소스로 공개하여 트레이더들이 기능을 검토하고 검증할 수 있도록 했습니다. 작성자에게 찬사를 보냅니다! 이 코드는 무료로 사용할 수 있지만, 코드를 재게시하는 경우 하우스 룰이 적용된다는 점을 기억하세요.
면책사항
해당 정보와 게시물은 금융, 투자, 트레이딩 또는 기타 유형의 조언이나 권장 사항으로 간주되지 않으며, 트레이딩뷰에서 제공하거나 보증하는 것이 아닙니다. 자세한 내용은 이용 약관을 참조하세요.
오픈 소스 스크립트
트레이딩뷰의 진정한 정신에 따라, 이 스크립트의 작성자는 이를 오픈소스로 공개하여 트레이더들이 기능을 검토하고 검증할 수 있도록 했습니다. 작성자에게 찬사를 보냅니다! 이 코드는 무료로 사용할 수 있지만, 코드를 재게시하는 경우 하우스 룰이 적용된다는 점을 기억하세요.
면책사항
해당 정보와 게시물은 금융, 투자, 트레이딩 또는 기타 유형의 조언이나 권장 사항으로 간주되지 않으며, 트레이딩뷰에서 제공하거나 보증하는 것이 아닙니다. 자세한 내용은 이용 약관을 참조하세요.