PROTECTED SOURCE SCRIPT
atrATR
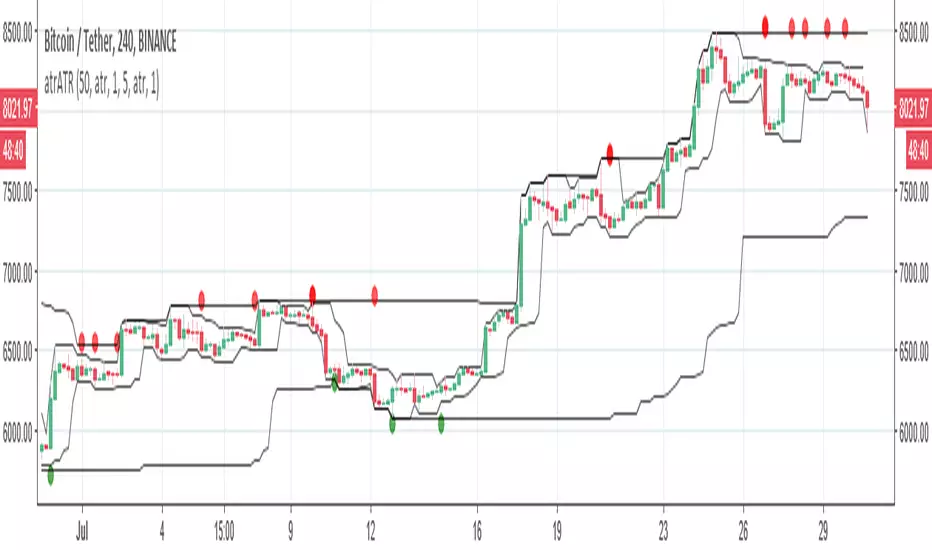
so this easy to see indicator based on ATR and donochian channel
there is fast and there is slow channels . when they are kissing each other then either in the low point or high point is change of trend. for example: the price went to high point and the fast channel is departing down from the slow this is time to sell.
the opposite when the fast channel departing up from the slow channel
it the same mechanism of the linear regression just more accurate.
the circles are just point where ATR think it time to buy or sell. but this is easy way to think on trends and to figure out if you going short or long
보호된 스크립트입니다
이 스크립트는 비공개 소스로 게시됩니다. 하지만 이를 자유롭게 제한 없이 사용할 수 있습니다 – 자세한 내용은 여기에서 확인하세요.
면책사항
해당 정보와 게시물은 금융, 투자, 트레이딩 또는 기타 유형의 조언이나 권장 사항으로 간주되지 않으며, 트레이딩뷰에서 제공하거나 보증하는 것이 아닙니다. 자세한 내용은 이용 약관을 참조하세요.
보호된 스크립트입니다
이 스크립트는 비공개 소스로 게시됩니다. 하지만 이를 자유롭게 제한 없이 사용할 수 있습니다 – 자세한 내용은 여기에서 확인하세요.
면책사항
해당 정보와 게시물은 금융, 투자, 트레이딩 또는 기타 유형의 조언이나 권장 사항으로 간주되지 않으며, 트레이딩뷰에서 제공하거나 보증하는 것이 아닙니다. 자세한 내용은 이용 약관을 참조하세요.