PROTECTED SOURCE SCRIPT
Fiscasset Day Separator
Description:
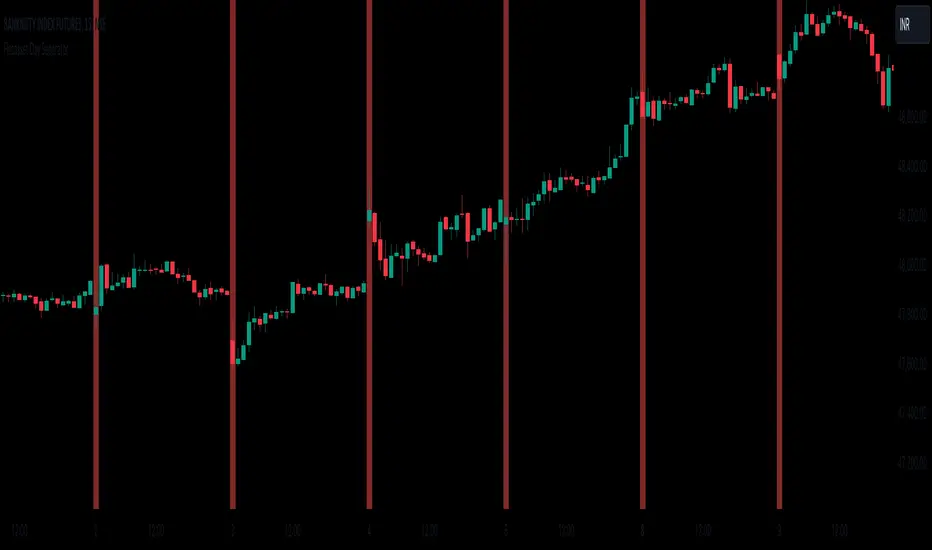
The Fiscasset Day Separator is a simple yet effective indicator designed to help traders visually separate trading days on their charts. This indicator plots a vertical line at the start of each new day, making it easier to analyze daily price movements and identify patterns.
Key Features:
Day Separation: Automatically detects and marks the start of a new trading day with a vertical line.
Visual Clarity: The indicator uses a red triangle to highlight the beginning of each day, providing clear visual separation.
Background Highlight: Optionally, a semi-transparent red background color is applied at the start of each new day for enhanced visual distinction.
Usage:
Intraday Traders: Ideal for intraday traders who need to quickly differentiate between different trading days.
Pattern Recognition: Helps in recognizing daily patterns and price behaviors by clearly separating each trading day.
Customization: Users can adjust the style and color of the separator to fit their preferences.
How It Works:
The indicator detects the start of a new day by comparing the current bar's day of the week with the previous bar's day of the week.
When a new day is detected, a vertical line is plotted above the bar.
An optional background color is applied to highlight the start of the new day further.
Example Usage:
Apply the Fiscasset Day Separator to your chart to easily distinguish between trading days and enhance your market analysis.
Disclaimer:
This script is provided for educational purposes and does not constitute financial advice. Traders should use it in conjunction with other tools and perform their own analysis before making trading decisions.
보호된 스크립트입니다
이 스크립트는 비공개 소스로 게시됩니다. 하지만 제한 없이 자유롭게 사용할 수 있습니다 — 여기에서 자세히 알아보기.
Biswapriyo Kundu
면책사항
이 정보와 게시물은 TradingView에서 제공하거나 보증하는 금융, 투자, 거래 또는 기타 유형의 조언이나 권고 사항을 의미하거나 구성하지 않습니다. 자세한 내용은 이용 약관을 참고하세요.
보호된 스크립트입니다
이 스크립트는 비공개 소스로 게시됩니다. 하지만 제한 없이 자유롭게 사용할 수 있습니다 — 여기에서 자세히 알아보기.
Biswapriyo Kundu
면책사항
이 정보와 게시물은 TradingView에서 제공하거나 보증하는 금융, 투자, 거래 또는 기타 유형의 조언이나 권고 사항을 의미하거나 구성하지 않습니다. 자세한 내용은 이용 약관을 참고하세요.