OPEN-SOURCE SCRIPT
업데이트됨 Rotation Cycles Graph
Rotation Cycles Graph Indicator
Overview:
The Rotation Cycles Graph Indicator is designed to visualize rotation cycles in financial markets. It aims to provide insights into shifts between various market phases, including growth, weakening, recovery, and contraction, allowing traders to potentially identify changing market dynamics.
Key Components:
Customizable Parameters:
The indicator offers users the flexibility to adjust several parameters:
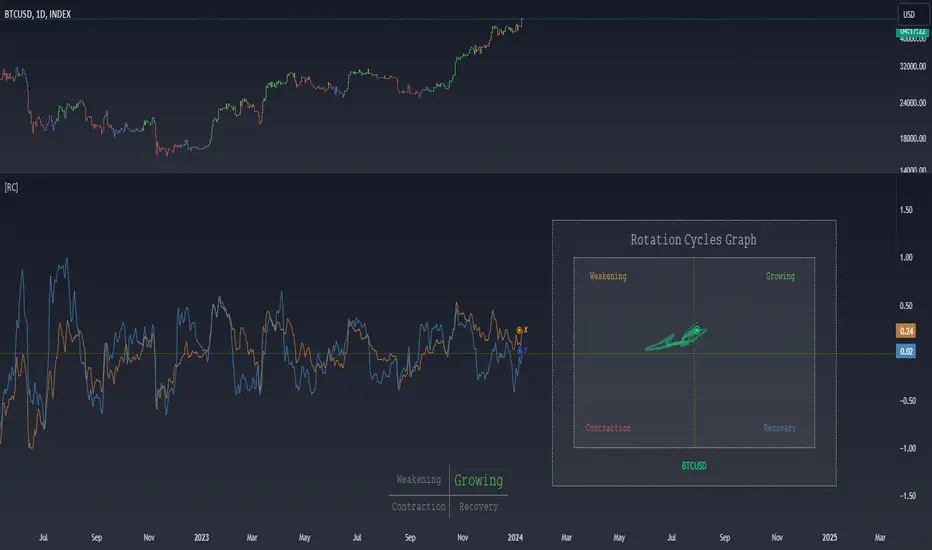
Understanding Coordinates:
The x and y coordinates plotted on the chart represent specific market conditions. Interpretation of these coordinates aids in recognizing shifts in market behavior.
This screenshot shows visual representation behind logic of X and Y and their rotation cycles

Here is an example how rotation marker moved from growing to weakening and to the contraction quad, during a big market crush:

Note:
This indicator is a visualization tool and should be used in conjunction with other analytical methods for comprehensive market analysis.
Understanding the context and nuances of market dynamics is essential for accurate interpretation of the Rotation Cycles Graph Indicator.
Big thanks to PineCodersTASC for their indicator, what I used as a reference
https://in.tradingview.com/script/AsEv0Vxd-TASC-2022-07-Pairs-Rotation-With-Ehlers-Loops/
Overview:
The Rotation Cycles Graph Indicator is designed to visualize rotation cycles in financial markets. It aims to provide insights into shifts between various market phases, including growth, weakening, recovery, and contraction, allowing traders to potentially identify changing market dynamics.
Key Components:
- Z-Score Calculation:
The indicator employs Z-score calculation to normalize data and identify deviations from the mean. This is instrumental in understanding the current state of the market relative to its historical behavior. - Ehlers Loop Visualization:
The Ehlers Loop function generates a visual representation of rotation cycles. It utilizes x and y coordinates on the chart to represent market conditions. These coordinates determine the position and categorization of the market state. - Table Visualization:
At the bottom of the chart, a table categorizes market conditions based on x and y values. This table serves as a reference to understand the current market phase.
Customizable Parameters:
The indicator offers users the flexibility to adjust several parameters:
- Length and Smoothness: Users can set the length and smoothness parameters for the Z-score calculation, allowing for customization based on the market's volatility.
- Graph Settings: Parameters such as bar scale, graph position, and the length of the tail for visualization can be fine-tuned to suit individual preferences.
Understanding Coordinates:
The x and y coordinates plotted on the chart represent specific market conditions. Interpretation of these coordinates aids in recognizing shifts in market behavior.
This screenshot shows visual representation behind logic of X and Y and their rotation cycles
Here is an example how rotation marker moved from growing to weakening and to the contraction quad, during a big market crush:
Note:
This indicator is a visualization tool and should be used in conjunction with other analytical methods for comprehensive market analysis.
Understanding the context and nuances of market dynamics is essential for accurate interpretation of the Rotation Cycles Graph Indicator.
Big thanks to PineCodersTASC for their indicator, what I used as a reference
https://in.tradingview.com/script/AsEv0Vxd-TASC-2022-07-Pairs-Rotation-With-Ehlers-Loops/
릴리즈 노트
Rescale function릴리즈 노트
Moved name of the ticker to the bottom of the graph릴리즈 노트
-릴리즈 노트
Alerts Update오픈 소스 스크립트
트레이딩뷰의 진정한 정신에 따라, 이 스크립트의 작성자는 이를 오픈소스로 공개하여 트레이더들이 기능을 검토하고 검증할 수 있도록 했습니다. 작성자에게 찬사를 보냅니다! 이 코드는 무료로 사용할 수 있지만, 코드를 재게시하는 경우 하우스 룰이 적용된다는 점을 기억하세요.
면책사항
해당 정보와 게시물은 금융, 투자, 트레이딩 또는 기타 유형의 조언이나 권장 사항으로 간주되지 않으며, 트레이딩뷰에서 제공하거나 보증하는 것이 아닙니다. 자세한 내용은 이용 약관을 참조하세요.
오픈 소스 스크립트
트레이딩뷰의 진정한 정신에 따라, 이 스크립트의 작성자는 이를 오픈소스로 공개하여 트레이더들이 기능을 검토하고 검증할 수 있도록 했습니다. 작성자에게 찬사를 보냅니다! 이 코드는 무료로 사용할 수 있지만, 코드를 재게시하는 경우 하우스 룰이 적용된다는 점을 기억하세요.
면책사항
해당 정보와 게시물은 금융, 투자, 트레이딩 또는 기타 유형의 조언이나 권장 사항으로 간주되지 않으며, 트레이딩뷰에서 제공하거나 보증하는 것이 아닙니다. 자세한 내용은 이용 약관을 참조하세요.