PROTECTED SOURCE SCRIPT
업데이트됨 TMA - Divergence Indicator
█ OVERVIEW
This indicator was inspired by Arty and Christy. I have taken what they teach and combined it into this amazing RSI Divergence Oscillator.
█ COMPONENTS
Here is a brief overview of the indicator:
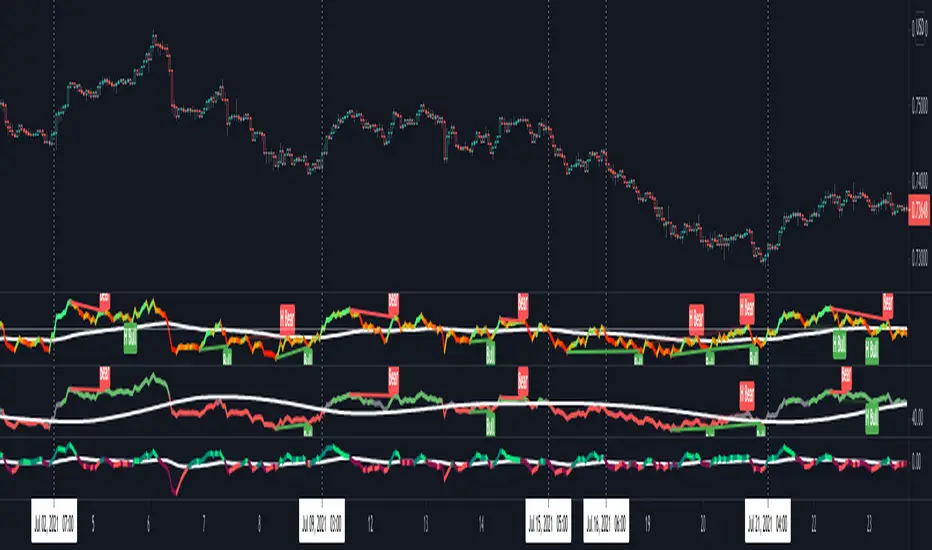
1 — RSI Divergence
Arty uses the RSI divergence as a tool to find entry points and possible reversals. He doesn't use the traditional overbought/oversold. He uses a 50 line. This indicator includes a 50 line and a floating 50 line.
The floating 50 line is a multi-timeframe smoothed moving average. Price is not linear, therefore, your 50 line shouldn't be either.
The RSI line is using a dynamic color algo that shows current control of the market as well as possible turning points in the market. Think of it as a momentum indicator inside your momentum indicator, pretty cool, huh?
2 — Smoothed RSI Divergence
The Smoothed RSI Divergence is a slower RSI with different calculations to smooth out the RSI line. This gives a different perspective of price action and more of a long term perspective of the trend. When crosses of the floating 50 line up with the traditional RSI crossing floating 50, these are amazing entries!
3 — Momentum Divergence
This is my baby. This one will take a little bit of time to master, (and I will be doing videos for you). But, once you master this, and combined with the other two, damn these entries get downright lethal!
This indicator was inspired by Arty and Christy. I have taken what they teach and combined it into this amazing RSI Divergence Oscillator.
█ COMPONENTS
Here is a brief overview of the indicator:
1 — RSI Divergence
Arty uses the RSI divergence as a tool to find entry points and possible reversals. He doesn't use the traditional overbought/oversold. He uses a 50 line. This indicator includes a 50 line and a floating 50 line.
The floating 50 line is a multi-timeframe smoothed moving average. Price is not linear, therefore, your 50 line shouldn't be either.
The RSI line is using a dynamic color algo that shows current control of the market as well as possible turning points in the market. Think of it as a momentum indicator inside your momentum indicator, pretty cool, huh?
2 — Smoothed RSI Divergence
The Smoothed RSI Divergence is a slower RSI with different calculations to smooth out the RSI line. This gives a different perspective of price action and more of a long term perspective of the trend. When crosses of the floating 50 line up with the traditional RSI crossing floating 50, these are amazing entries!
3 — Momentum Divergence
This is my baby. This one will take a little bit of time to master, (and I will be doing videos for you). But, once you master this, and combined with the other two, damn these entries get downright lethal!
릴리즈 노트
Updated chart to show price action릴리즈 노트
Small fix릴리즈 노트
Small code adjustments릴리즈 노트
Minor fixes1 - Added extreme levels (OB/OS)
2 - Preview of alerts to come
릴리즈 노트
Added Disclaimer1 — Added alerts for divergences
3 — Added alerts for floating 50 cross over and cross under
릴리즈 노트
Small code tweak보호된 스크립트입니다
이 스크립트는 비공개 소스로 게시됩니다. 하지만 제한 없이 자유롭게 사용할 수 있습니다 — 여기에서 자세히 알아보기.
면책사항
이 정보와 게시물은 TradingView에서 제공하거나 보증하는 금융, 투자, 거래 또는 기타 유형의 조언이나 권고 사항을 의미하거나 구성하지 않습니다. 자세한 내용은 이용 약관을 참고하세요.
보호된 스크립트입니다
이 스크립트는 비공개 소스로 게시됩니다. 하지만 제한 없이 자유롭게 사용할 수 있습니다 — 여기에서 자세히 알아보기.
면책사항
이 정보와 게시물은 TradingView에서 제공하거나 보증하는 금융, 투자, 거래 또는 기타 유형의 조언이나 권고 사항을 의미하거나 구성하지 않습니다. 자세한 내용은 이용 약관을 참고하세요.