PROTECTED SOURCE SCRIPT
9-Candle Pattern + Support & Resistance
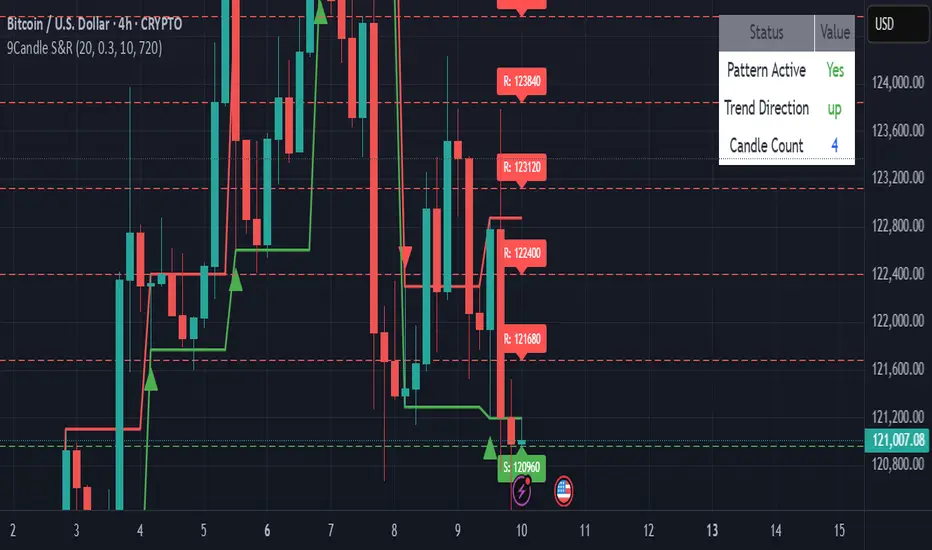
9-Candle Pattern + Support & Resistance Indicator
The 9-Candle Pattern + Support & Resistance indicator is a powerful technical analysis tool designed to identify short-term reversal patterns and key price levels on any chart. It combines candlestick pattern recognition with dynamic support and resistance zones, providing traders with actionable entry and exit signals.
Key Features
🔹 9-Candle Pattern Detection:
Automatically scans the chart for a 9-candle formation that often precedes potential trend reversals or breakout opportunities.
The pattern highlights price exhaustion zones where momentum is likely to shift.
🔹 Automatic Support & Resistance Levels:
Plots real-time support and resistance zones based on recent swing highs and lows, helping traders spot crucial decision points on the chart.
🔹 Multi-Timeframe Compatibility:
Works seamlessly across multiple timeframes, from intraday scalping to swing trading setups.
🔹 Custom Alerts:
Receive alerts when a valid 9-candle reversal pattern forms near a key support or resistance level — increasing the accuracy of trade confirmations.
🔹 Visual Clarity:
Clean visual cues for patterns and zones, making chart analysis intuitive without clutter.
How It Helps
This indicator simplifies technical analysis by merging price action logic with market structure awareness.
Traders can quickly identify:
Potential reversal zones
Breakout opportunities
High-probability entries aligned with strong S/R levels
Best For
Price action traders
Swing and intraday traders
Traders using confluence-based strategies
보호된 스크립트입니다
이 스크립트는 비공개 소스로 게시됩니다. 하지만 제한 없이 자유롭게 사용할 수 있습니다 — 여기에서 자세히 알아보기.
면책사항
이 정보와 게시물은 TradingView에서 제공하거나 보증하는 금융, 투자, 거래 또는 기타 유형의 조언이나 권고 사항을 의미하거나 구성하지 않습니다. 자세한 내용은 이용 약관을 참고하세요.
보호된 스크립트입니다
이 스크립트는 비공개 소스로 게시됩니다. 하지만 제한 없이 자유롭게 사용할 수 있습니다 — 여기에서 자세히 알아보기.
면책사항
이 정보와 게시물은 TradingView에서 제공하거나 보증하는 금융, 투자, 거래 또는 기타 유형의 조언이나 권고 사항을 의미하거나 구성하지 않습니다. 자세한 내용은 이용 약관을 참고하세요.