OPEN-SOURCE SCRIPT
업데이트됨 Stock metrics and value

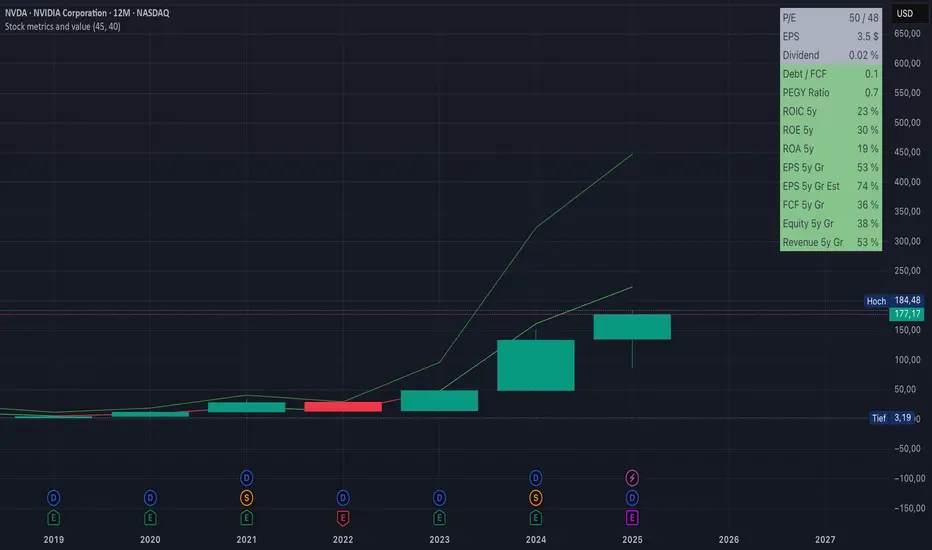
This indicator shows:
- the valuation metrics for a stock on a table on top right: PE, EPS, dividend, ROIC, ROE, ROA, EPS growth, FCF growth, Equity growth, revenue Growth
- the fair value and the value with 50% margin of safety as chart lines
The lines will be red when they are above the current price and red when they are below the current price.
The colors on the table will be red when the values are below 10% and green when they are above, that means when everything is green the metrics for the stock are good.
릴리즈 노트
Added the type "depository receipt" to be included for this indicator릴리즈 노트
- Changed the calculation of the value to estimate only 5 years ahead with 15% yield instead of 10 years- Changed the past growth calculations to 5 years instead of 10 years
릴리즈 노트
Added Peter Lynch's PEGY ratio, P/E devided by (growth rate + dividend yield)오픈 소스 스크립트
트레이딩뷰의 진정한 정신에 따라, 이 스크립트의 작성자는 이를 오픈소스로 공개하여 트레이더들이 기능을 검토하고 검증할 수 있도록 했습니다. 작성자에게 찬사를 보냅니다! 이 코드는 무료로 사용할 수 있지만, 코드를 재게시하는 경우 하우스 룰이 적용된다는 점을 기억하세요.
면책사항
해당 정보와 게시물은 금융, 투자, 트레이딩 또는 기타 유형의 조언이나 권장 사항으로 간주되지 않으며, 트레이딩뷰에서 제공하거나 보증하는 것이 아닙니다. 자세한 내용은 이용 약관을 참조하세요.
오픈 소스 스크립트
트레이딩뷰의 진정한 정신에 따라, 이 스크립트의 작성자는 이를 오픈소스로 공개하여 트레이더들이 기능을 검토하고 검증할 수 있도록 했습니다. 작성자에게 찬사를 보냅니다! 이 코드는 무료로 사용할 수 있지만, 코드를 재게시하는 경우 하우스 룰이 적용된다는 점을 기억하세요.
면책사항
해당 정보와 게시물은 금융, 투자, 트레이딩 또는 기타 유형의 조언이나 권장 사항으로 간주되지 않으며, 트레이딩뷰에서 제공하거나 보증하는 것이 아닙니다. 자세한 내용은 이용 약관을 참조하세요.