PROTECTED SOURCE SCRIPT
업데이트됨 Phase Pattern Detector v2
Phase Pattern Detector
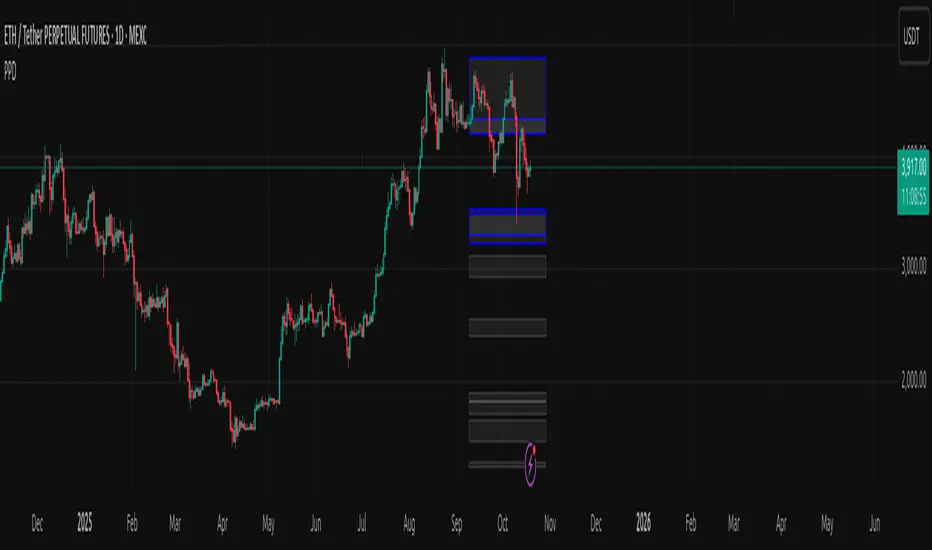
This indicator identifies and highlights structural price phases—areas where market behavior tends to repeat or shift. It visualizes the rhythm of price action rather than measuring momentum or volatility. Each phase is represented by visual zones that help traders recognize potential transitions between market states.
The tool does not provide buy or sell signals, nor does it predict future movement. It simply exposes patterns in price behavior to support analytical observation.
Users are solely responsible for any trading decisions made based on its visual cues. This indicator is meant for context and awareness, not for execution.
Always combine structural analysis with your own judgment, broader market context, and proper risk management.
릴리즈 노트
Minör fixes보호된 스크립트입니다
이 스크립트는 비공개 소스로 게시됩니다. 하지만 제한 없이 자유롭게 사용할 수 있습니다 — 여기에서 자세히 알아보기.
면책사항
이 정보와 게시물은 TradingView에서 제공하거나 보증하는 금융, 투자, 거래 또는 기타 유형의 조언이나 권고 사항을 의미하거나 구성하지 않습니다. 자세한 내용은 이용 약관을 참고하세요.
보호된 스크립트입니다
이 스크립트는 비공개 소스로 게시됩니다. 하지만 제한 없이 자유롭게 사용할 수 있습니다 — 여기에서 자세히 알아보기.
면책사항
이 정보와 게시물은 TradingView에서 제공하거나 보증하는 금융, 투자, 거래 또는 기타 유형의 조언이나 권고 사항을 의미하거나 구성하지 않습니다. 자세한 내용은 이용 약관을 참고하세요.