OPEN-SOURCE SCRIPT
업데이트됨 Relative Strength NSE:Nifty for TF Community
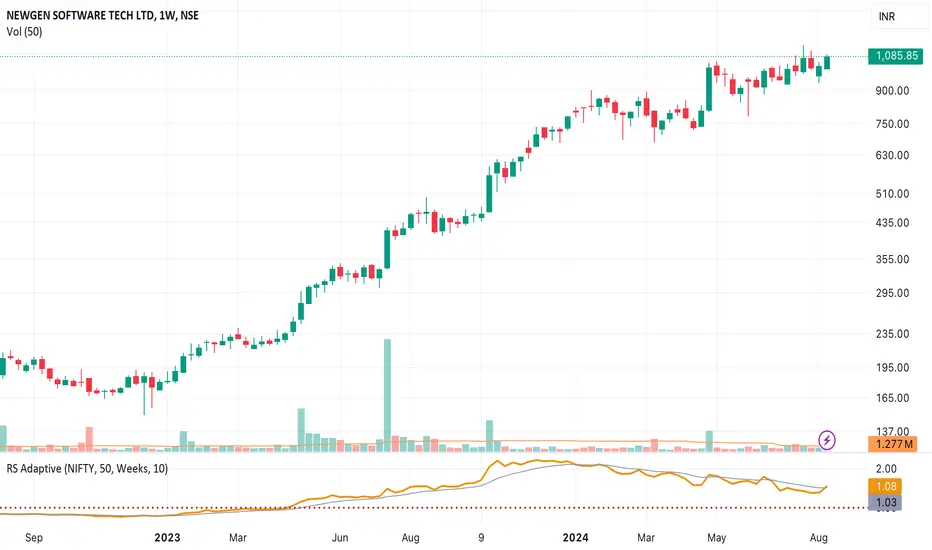
This is a modified version of the Relative Strength Indicator (No confusion with RSI) originally by in.tradingview.com/u/modhelius/ based on in.tradingview.com/script/A4WyMCKM-Relative-Strength/. The indicator calculates the relative strength between a selected stock and a comparative symbol (typically a market index like NSE:NIFTY).
Relative strength (RS) compares the performance of two assets, typically a stock and a market index, by dividing their percentage changes over a specific period. This indicator oscillates around zero:
- Greater than 0: Indicates the stock has outperformed the comparative symbol.
- Less than 0: Indicates the stock has underperformed the comparative symbol.
Key Enhancements:
This Relative Strength Indicator offers practical features to automatically adjusts the comparison period based on the chart’s timeframe, whether daily, weekly, or monthly, so you don’t have to make manual changes.
Secondly, if the selected stock has fewer bars than the comparison period, the indicator uses the shorter period to ensure accurate results. The default colors are hardcoded so they look fine for both dark and white themes, but of course can be changed.
You can customise the settings to fit your needs. The default period is set to 50/52, and the comparative symbol is NSE:NIFTY, but both can be changed. There’s also an option to toggle a moving average on or off, providing a smoother visual representation.
릴리즈 노트
Change the SMA to EMA as per TF Community recommendation - Exponential MA is better than Simple MA. 릴리즈 노트
Chart changed to simple one. 오픈 소스 스크립트
트레이딩뷰의 진정한 정신에 따라, 이 스크립트의 작성자는 이를 오픈소스로 공개하여 트레이더들이 기능을 검토하고 검증할 수 있도록 했습니다. 작성자에게 찬사를 보냅니다! 이 코드는 무료로 사용할 수 있지만, 코드를 재게시하는 경우 하우스 룰이 적용된다는 점을 기억하세요.
면책사항
해당 정보와 게시물은 금융, 투자, 트레이딩 또는 기타 유형의 조언이나 권장 사항으로 간주되지 않으며, 트레이딩뷰에서 제공하거나 보증하는 것이 아닙니다. 자세한 내용은 이용 약관을 참조하세요.
오픈 소스 스크립트
트레이딩뷰의 진정한 정신에 따라, 이 스크립트의 작성자는 이를 오픈소스로 공개하여 트레이더들이 기능을 검토하고 검증할 수 있도록 했습니다. 작성자에게 찬사를 보냅니다! 이 코드는 무료로 사용할 수 있지만, 코드를 재게시하는 경우 하우스 룰이 적용된다는 점을 기억하세요.
면책사항
해당 정보와 게시물은 금융, 투자, 트레이딩 또는 기타 유형의 조언이나 권장 사항으로 간주되지 않으며, 트레이딩뷰에서 제공하거나 보증하는 것이 아닙니다. 자세한 내용은 이용 약관을 참조하세요.