OPEN-SOURCE SCRIPT
업데이트됨 Logarithmic Bollinger Bands with Secondary Band
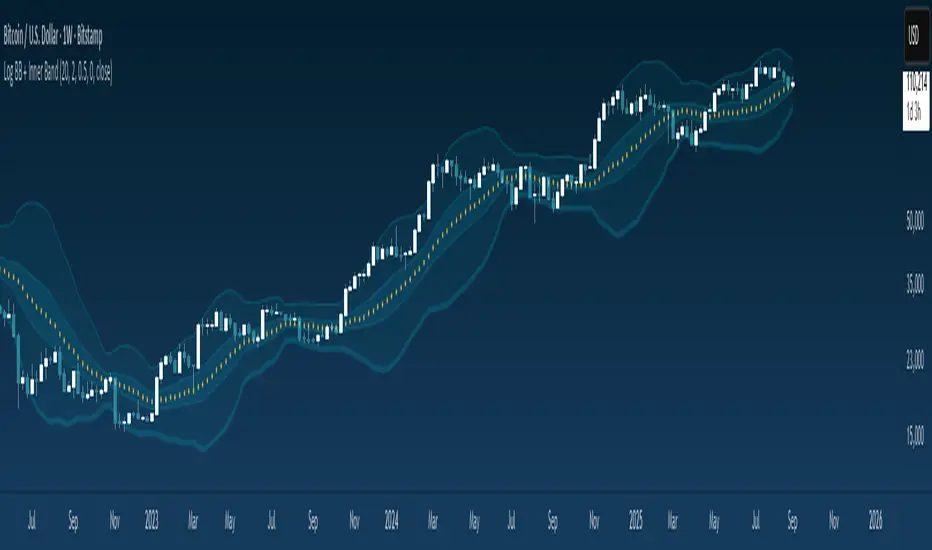
The Logarithmic Bollinger Bands indicator is a variation of standard Bollinger Bands that applies the calculation on a logarithmic scale rather than directly on price values. This approach is particularly useful in markets where assets experience exponential growth or large percentage-based moves, as it allows the bands to adapt proportionally instead of being distorted by absolute price changes. The indicator calculates a moving average of the log-transformed price (the basis), then adds and subtracts multiples of the standard deviation of the log price to form the upper and lower bands. Finally, the results are converted back to normal price scale for plotting. In addition to the primary bands set at 2.0 standard deviations, this version includes a secondary band set at 0.5 standard deviations, offering a closer inner envelope around the mean.
To use this indicator
Traders can observe how price interacts with both the inner and outer bands. The outer 2.0 standard deviation bands represent traditional Bollinger-style boundaries, highlighting potential overbought or oversold conditions when price pushes beyond them.
The inner 0.5 bands provide an earlier signal of price compression and breakout potential, as moves outside these tighter bands often precede larger volatility expansions.
Together, these dual layers give traders a way to monitor both short-term fluctuations and broader trend extremes, making it easier to spot opportunities for entries, exits, or risk management in markets where percentage-based scaling is more meaningful than raw price levels.
릴리즈 노트
Update colors + styles오픈 소스 스크립트
트레이딩뷰의 진정한 정신에 따라, 이 스크립트의 작성자는 이를 오픈소스로 공개하여 트레이더들이 기능을 검토하고 검증할 수 있도록 했습니다. 작성자에게 찬사를 보냅니다! 이 코드는 무료로 사용할 수 있지만, 코드를 재게시하는 경우 하우스 룰이 적용된다는 점을 기억하세요.
면책사항
해당 정보와 게시물은 금융, 투자, 트레이딩 또는 기타 유형의 조언이나 권장 사항으로 간주되지 않으며, 트레이딩뷰에서 제공하거나 보증하는 것이 아닙니다. 자세한 내용은 이용 약관을 참조하세요.
오픈 소스 스크립트
트레이딩뷰의 진정한 정신에 따라, 이 스크립트의 작성자는 이를 오픈소스로 공개하여 트레이더들이 기능을 검토하고 검증할 수 있도록 했습니다. 작성자에게 찬사를 보냅니다! 이 코드는 무료로 사용할 수 있지만, 코드를 재게시하는 경우 하우스 룰이 적용된다는 점을 기억하세요.
면책사항
해당 정보와 게시물은 금융, 투자, 트레이딩 또는 기타 유형의 조언이나 권장 사항으로 간주되지 않으며, 트레이딩뷰에서 제공하거나 보증하는 것이 아닙니다. 자세한 내용은 이용 약관을 참조하세요.