OPEN-SOURCE SCRIPT
Quarterly Theory —Q1,Q2,Q3,Q4
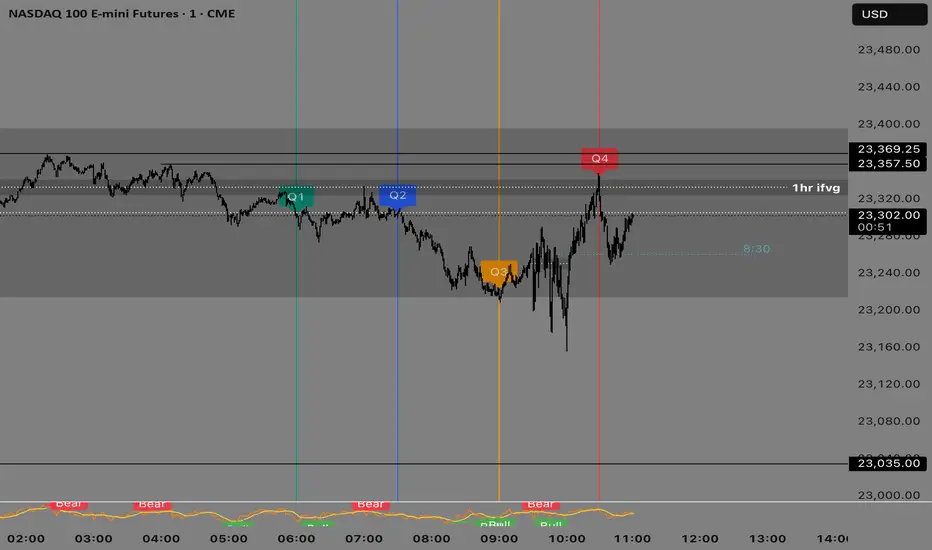
The Quarterly Theory Indicator is a trading tool designed to visualize the natural time-based cycles of the market, based on the principles of Quarterly Theory, popularized by the Inner Circle Trader (ICT). The indicator divides market sessions into four equal “quarters” to help traders identify potential accumulation, manipulation, and distribution phases (AMD model) and improve the timing of entries and exits.
Key Features:
Quarter Divisions (Q1–Q4):
Each market session (e.g., NY AM, London, Asia) is divided into four quarters.
Vertical lines mark the beginning of each quarter, making it easy to track session structure.
Optional labels show Q1, Q2, Q3, and Q4 directly on the chart.
True Open (Q2 Open):
The True Open is the opening price of Q2, considered a key reference point in Quarterly Theory.
A horizontal red line is drawn at the True Open price with a label showing the exact value.
This line helps traders filter bullish and bearish setups:
Buy below the True Open if the market is bullish.
Sell above the True Open if the market is bearish.
Session Awareness:
The indicator can automatically detect market sessions and reset lines and labels for each new session.
Ensures that only the current session’s True Open and quarter lines are displayed, reducing chart clutter.
Timeframe Flexibility:
Works on any chart timeframe (1-minute to daily).
Maintains accurate alignment of quarters and True Open regardless of the timeframe used.
Purpose of Quarterly Theory:
Quarterly Theory is based on the idea that market behavior is fractal and time-driven. By dividing sessions into four quarters, traders can anticipate potential market phases:
Q1: Initial price discovery and setup for the session.
Q2: Accumulation or manipulation phase, where the True Open is established.
Q3: Manipulation or Judas Swing phase designed to trap traders.
Q4: Distribution or trend continuation/reversal.
By visualizing these quarters and the True Open, traders can reduce ambiguity, identify high-probability setups, and improve their timing in line with the ICT AMD (Accumulation, Manipulation, Distribution) framework.
오픈 소스 스크립트
트레이딩뷰의 진정한 정신에 따라, 이 스크립트의 작성자는 이를 오픈소스로 공개하여 트레이더들이 기능을 검토하고 검증할 수 있도록 했습니다. 작성자에게 찬사를 보냅니다! 이 코드는 무료로 사용할 수 있지만, 코드를 재게시하는 경우 하우스 룰이 적용된다는 점을 기억하세요.
면책사항
해당 정보와 게시물은 금융, 투자, 트레이딩 또는 기타 유형의 조언이나 권장 사항으로 간주되지 않으며, 트레이딩뷰에서 제공하거나 보증하는 것이 아닙니다. 자세한 내용은 이용 약관을 참조하세요.
오픈 소스 스크립트
트레이딩뷰의 진정한 정신에 따라, 이 스크립트의 작성자는 이를 오픈소스로 공개하여 트레이더들이 기능을 검토하고 검증할 수 있도록 했습니다. 작성자에게 찬사를 보냅니다! 이 코드는 무료로 사용할 수 있지만, 코드를 재게시하는 경우 하우스 룰이 적용된다는 점을 기억하세요.
면책사항
해당 정보와 게시물은 금융, 투자, 트레이딩 또는 기타 유형의 조언이나 권장 사항으로 간주되지 않으며, 트레이딩뷰에서 제공하거나 보증하는 것이 아닙니다. 자세한 내용은 이용 약관을 참조하세요.