INVITE-ONLY SCRIPT
Two Box Theory
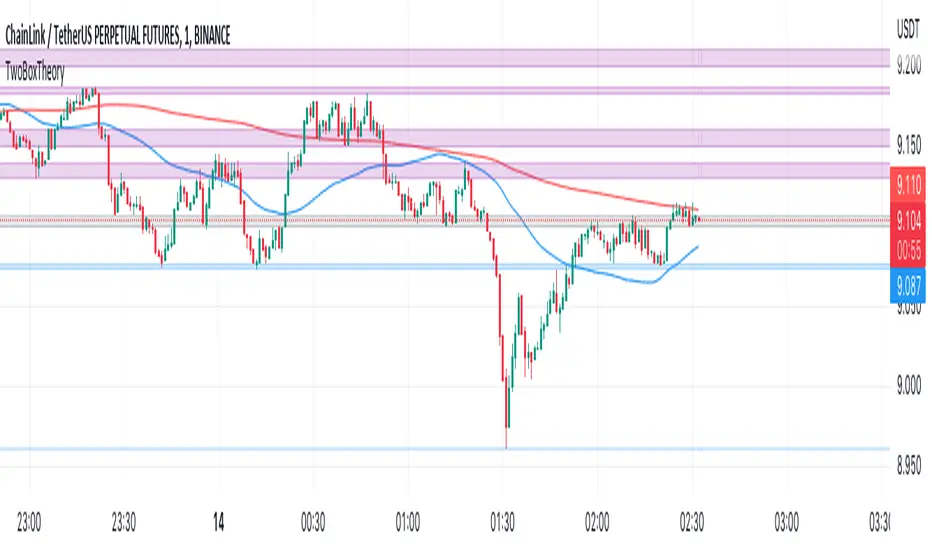
A channel is where the price action travels between two rectangular boxes. The Purple box line is treated as resistance and the Blue box line is treated as support.
Two Box Theory is a TradingView TM indicator that automatically locates and prints key support and resistance levels.
Its responsibility lies in its capacity to offer real-time visualisation to support your trade.
It is a flexible indicator that can be used for short or long time frames and has a precision of 8 decimal points, making it appropriate for all types of markets.
You can choose to get alerts immediately because each condition has its own set of alerts.
Two Box Theory has been tried, true, and tested for more than a year and has already earned the faith of those who have used it.
Two Box Theory has what it takes to take your trading to the next level, whether it's used as a stand-alone method or as an addition to your current approach.
Read the description to better understand the functions of this indicator.
1- It will automatically find Pivot Points to determine support and resistance by calculating extensive amount of data.
2- When it calculates new Pivot Points it will remove previous ones and the support/resistance channels will be updated.
3- For every upcoming Pivot Point it scans all previous Pivot Points in its channel horizontally.
4- It will show a different box (grey) when price action goes sideways. This is when the coin is in a no trade zone.
5- After breaking that level(grey box) upwards, it will change colour of its box to make support channel.
6- It will also alert you when the support or resistance breaks, you can set the alerts in the settings.
7- It also includes two Simple Moving Averages for further confirmations.
Here are some screenshots to understand how it functions:
The Auto-Support/Resistance feature in this indicator uses Artificial Intelligence (AI) to automatically plot the support/resistance levels and show them based on the strength of different levels to perform analysis.
AI is used to detect the support/resistance levels and rated based on the following factors:
i- Number of touches
ii- Length of the line
iii- Recency of the line
iv- Violations of the line
You can manage risk according to the support and resistance to set Stop-Loss and the potential take-profit based on the nearest support/resistance levels
Stop loss and take profit levels are made easy on this indicator and if you follow the instructions properly, your accuracy rate should lie between 85-95%
For example:
Support indications:

Resistance Indications and trading technique:

Resistance convert into support:

Two Box Theory is a TradingView TM indicator that automatically locates and prints key support and resistance levels.
Its responsibility lies in its capacity to offer real-time visualisation to support your trade.
It is a flexible indicator that can be used for short or long time frames and has a precision of 8 decimal points, making it appropriate for all types of markets.
You can choose to get alerts immediately because each condition has its own set of alerts.
Two Box Theory has been tried, true, and tested for more than a year and has already earned the faith of those who have used it.
Two Box Theory has what it takes to take your trading to the next level, whether it's used as a stand-alone method or as an addition to your current approach.
Read the description to better understand the functions of this indicator.
1- It will automatically find Pivot Points to determine support and resistance by calculating extensive amount of data.
2- When it calculates new Pivot Points it will remove previous ones and the support/resistance channels will be updated.
3- For every upcoming Pivot Point it scans all previous Pivot Points in its channel horizontally.
4- It will show a different box (grey) when price action goes sideways. This is when the coin is in a no trade zone.
5- After breaking that level(grey box) upwards, it will change colour of its box to make support channel.
6- It will also alert you when the support or resistance breaks, you can set the alerts in the settings.
7- It also includes two Simple Moving Averages for further confirmations.
Here are some screenshots to understand how it functions:
The Auto-Support/Resistance feature in this indicator uses Artificial Intelligence (AI) to automatically plot the support/resistance levels and show them based on the strength of different levels to perform analysis.
AI is used to detect the support/resistance levels and rated based on the following factors:
i- Number of touches
ii- Length of the line
iii- Recency of the line
iv- Violations of the line
You can manage risk according to the support and resistance to set Stop-Loss and the potential take-profit based on the nearest support/resistance levels
Stop loss and take profit levels are made easy on this indicator and if you follow the instructions properly, your accuracy rate should lie between 85-95%
For example:
Support indications:
Resistance Indications and trading technique:
Resistance convert into support:
초대 전용 스크립트
이 스크립트는 작성자가 승인한 사용자만 접근할 수 있습니다. 사용하려면 요청 후 승인을 받아야 하며, 일반적으로 결제 후에 허가가 부여됩니다. 자세한 내용은 아래 작성자의 안내를 따르거나 MagnusPeterson에게 직접 문의하세요.
트레이딩뷰는 스크립트의 작동 방식을 충분히 이해하고 작성자를 완전히 신뢰하지 않는 이상, 해당 스크립트에 비용을 지불하거나 사용하는 것을 권장하지 않습니다. 커뮤니티 스크립트에서 무료 오픈소스 대안을 찾아보실 수도 있습니다.
작성자 지시 사항
If you need this indicator email me at Ivaylo0894@gmail.com
면책사항
해당 정보와 게시물은 금융, 투자, 트레이딩 또는 기타 유형의 조언이나 권장 사항으로 간주되지 않으며, 트레이딩뷰에서 제공하거나 보증하는 것이 아닙니다. 자세한 내용은 이용 약관을 참조하세요.