OPEN-SOURCE SCRIPT
Approx STH Unrealized Profit [Relative %]
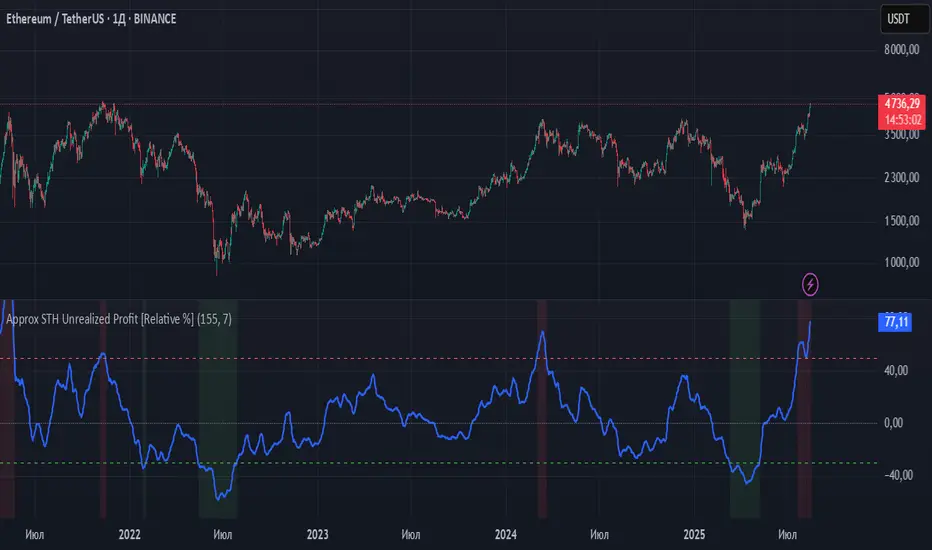
This indicator estimates the unrealized profit or loss of short-term holders (STH) without requiring on-chain data. Instead of using actual STH Realized Price (average purchase price), it employs a 155-day Simple Moving Average (SMA) to approximate the behavior of "recent buyers."
How It Works
The indicator calculates the percentage deviation between the current price and the 155-day SMA using the formula:
(Current Price - 155 SMA) / 155 SMA * 100%.
Positive values indicate profit, while negative values show loss. Key threshold levels are set at +50% (overbought) and -30% (oversold).
Trading Applications
Profit > 50% - STH are experiencing significant profits, suggesting potential correction. Consider taking partial profits.
0% < Profit < 50% - Moderate profits indicate the trend may continue. Maintain positions.
Profit ≈ 0% - Price is near STH's average entry point, showing market indecision.
-30% < Profit < 0% - STH are at a loss, potentially signaling accumulation opportunities.
Profit < -30% - Extreme oversold conditions may present buying opportunities.
Limitations
SMA only approximates STH behavior.
May produce false signals during sideways markets.
SMA lag can be noticeable in strong trending markets.
Recommendation
For improved accuracy, combine this indicator with trend-following tools (200 EMA, Volume analysis) and other technical indicators. It serves best as a supplementary tool for identifying overbought/oversold market conditions within your trading strategy.
오픈 소스 스크립트
진정한 트레이딩뷰 정신에 따라 이 스크립트 작성자는 트레이더가 기능을 검토하고 검증할 수 있도록 오픈소스로 공개했습니다. 작성자에게 찬사를 보냅니다! 무료로 사용할 수 있지만 코드를 다시 게시할 경우 하우스 룰이 적용된다는 점을 기억하세요.
💡 Обсуждаем торговые идеи , делимся индикаторами и стратегиями в нашем Telegram-чате:
👉 t.me/+AQWwxRhhrXI0YTgy
👉 t.me/+AQWwxRhhrXI0YTgy
면책사항
이 정보와 게시물은 TradingView에서 제공하거나 보증하는 금융, 투자, 거래 또는 기타 유형의 조언이나 권고 사항을 의미하거나 구성하지 않습니다. 자세한 내용은 이용 약관을 참고하세요.