PROTECTED SOURCE SCRIPT
업데이트됨 Black Arrow
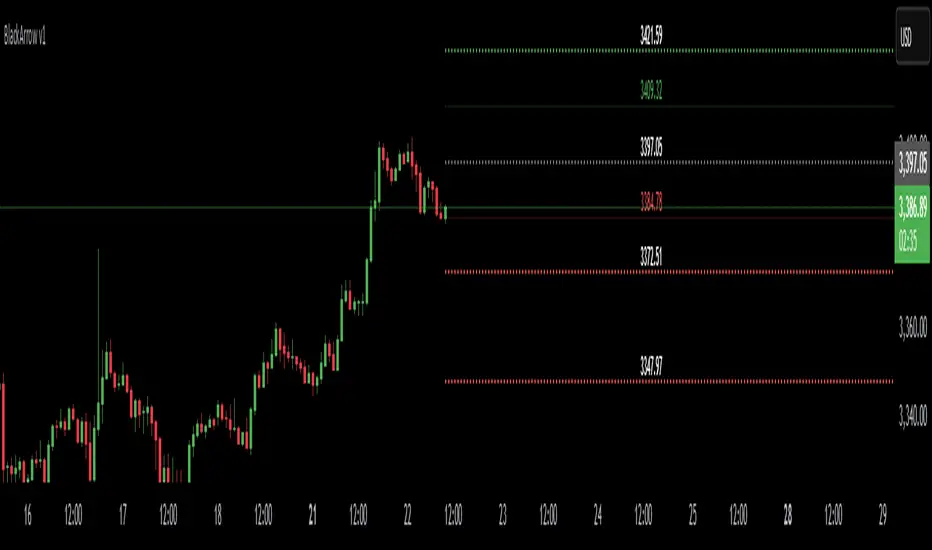
Expected Move Levels - Closer Prices
This script calculates and displays the expected move based on Implied Volatility (IV) and Days to Expiration (DTE). It helps traders visualize potential price movement ranges over a defined period using historical close price.
🔹 Key Features:
Customizable IV and DTE inputs
Displays 2 green levels above price and 2 red levels below, representing half and full expected move
Mid-lines between base price and first green/red level
Each level is labeled with its price value
Lines are drawn short and don't extend through the full chart for clarity
📘 Formula:
Expected Move = Price × IV × √(DTE / 365)
Use this tool to estimate market volatility zones and potential price targets without relying on traditional indicators.
릴리즈 노트
..릴리즈 노트
update보호된 스크립트입니다
이 스크립트는 비공개 소스로 게시됩니다. 하지만 이를 자유롭게 제한 없이 사용할 수 있습니다 – 자세한 내용은 여기에서 확인하세요.
면책사항
해당 정보와 게시물은 금융, 투자, 트레이딩 또는 기타 유형의 조언이나 권장 사항으로 간주되지 않으며, 트레이딩뷰에서 제공하거나 보증하는 것이 아닙니다. 자세한 내용은 이용 약관을 참조하세요.
보호된 스크립트입니다
이 스크립트는 비공개 소스로 게시됩니다. 하지만 이를 자유롭게 제한 없이 사용할 수 있습니다 – 자세한 내용은 여기에서 확인하세요.
면책사항
해당 정보와 게시물은 금융, 투자, 트레이딩 또는 기타 유형의 조언이나 권장 사항으로 간주되지 않으며, 트레이딩뷰에서 제공하거나 보증하는 것이 아닙니다. 자세한 내용은 이용 약관을 참조하세요.