OPEN-SOURCE SCRIPT
S&R Tracker [CHE]
Dynamic S&R Tracker [CHE]
1. Introduction to the Tool
Purpose:
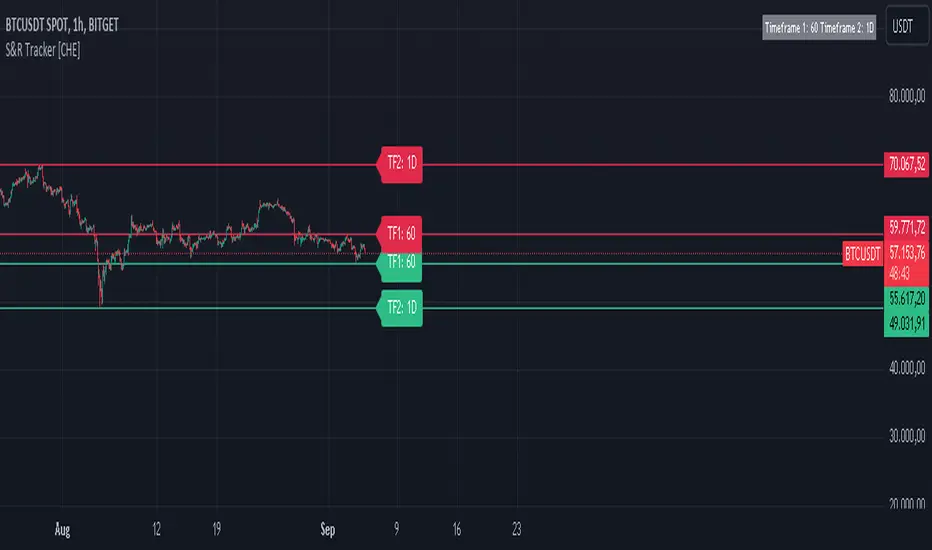
The Dynamic S&R Tracker [CHE] is a powerful TradingView tool designed to automatically detect and display support and resistance levels across multiple timeframes. It dynamically adjusts based on the current chart’s timeframe, making it easier for traders to identify key price levels for both shortterm and longterm analysis.
Key Features:
Dynamic adjustment of support and resistance levels based on realtime market conditions
Simultaneous visualization of support and resistance for two different timeframes
Automatic selection of optimal timeframes for accurate and efficient analysis
2. Functionality
Automatic Timeframe Selection:
The Dynamic S&R Tracker [CHE] uses a smart function to automatically adjust the analysis timeframe based on the market’s current conditions. It selects the appropriate intervals (e.g., 1 hour, 1 day, 1 month) for displaying support and resistance levels, reducing the need for manual intervention.
Support and Resistance Identification:
The tool calculates and identifies key pivot highs and lows, which act as support and resistance levels. These levels are displayed for two timeframes at once, giving a comprehensive view of the market's shortterm and longterm trends.
3. Benefits
Efficiency:
With automatic adjustments, traders save time by not having to manually change timeframes or recalculate levels.
Enhanced Market Insight:
By analyzing two timeframes simultaneously, the tool provides a broader market perspective, helping traders spot potential reversal points and breakouts.
Customizability:
Though dynamic, the Dynamic S&R Tracker [CHE] offers flexibility for manual adjustments, allowing traders to finetune the analysis based on personal preferences or market strategies.
4. Visualization
Support and Resistance Levels:
The tool uses clear visual markers—green for support and red for resistance—making it easy to spot critical price zones on the chart.
Informative Timeframe Display:
The tracker includes a customizable information box that shows the selected timeframes used in the analysis, keeping the user informed at all times.
5. Conclusion
The Dynamic S&R Tracker [CHE] is an essential tool for traders seeking an automated, precise, and flexible way to analyze support and resistance across multiple timeframes. By offering dynamic adjustments and clear visual feedback, it simplifies the decisionmaking process and provides deeper market insights.
Ideal for traders who need a streamlined and adaptable solution to better navigate market trends.
1. Introduction to the Tool
Purpose:
The Dynamic S&R Tracker [CHE] is a powerful TradingView tool designed to automatically detect and display support and resistance levels across multiple timeframes. It dynamically adjusts based on the current chart’s timeframe, making it easier for traders to identify key price levels for both shortterm and longterm analysis.
Key Features:
Dynamic adjustment of support and resistance levels based on realtime market conditions
Simultaneous visualization of support and resistance for two different timeframes
Automatic selection of optimal timeframes for accurate and efficient analysis
2. Functionality
Automatic Timeframe Selection:
The Dynamic S&R Tracker [CHE] uses a smart function to automatically adjust the analysis timeframe based on the market’s current conditions. It selects the appropriate intervals (e.g., 1 hour, 1 day, 1 month) for displaying support and resistance levels, reducing the need for manual intervention.
Support and Resistance Identification:
The tool calculates and identifies key pivot highs and lows, which act as support and resistance levels. These levels are displayed for two timeframes at once, giving a comprehensive view of the market's shortterm and longterm trends.
3. Benefits
Efficiency:
With automatic adjustments, traders save time by not having to manually change timeframes or recalculate levels.
Enhanced Market Insight:
By analyzing two timeframes simultaneously, the tool provides a broader market perspective, helping traders spot potential reversal points and breakouts.
Customizability:
Though dynamic, the Dynamic S&R Tracker [CHE] offers flexibility for manual adjustments, allowing traders to finetune the analysis based on personal preferences or market strategies.
4. Visualization
Support and Resistance Levels:
The tool uses clear visual markers—green for support and red for resistance—making it easy to spot critical price zones on the chart.
Informative Timeframe Display:
The tracker includes a customizable information box that shows the selected timeframes used in the analysis, keeping the user informed at all times.
5. Conclusion
The Dynamic S&R Tracker [CHE] is an essential tool for traders seeking an automated, precise, and flexible way to analyze support and resistance across multiple timeframes. By offering dynamic adjustments and clear visual feedback, it simplifies the decisionmaking process and provides deeper market insights.
Ideal for traders who need a streamlined and adaptable solution to better navigate market trends.
오픈 소스 스크립트
트레이딩뷰의 진정한 정신에 따라, 이 스크립트의 작성자는 이를 오픈소스로 공개하여 트레이더들이 기능을 검토하고 검증할 수 있도록 했습니다. 작성자에게 찬사를 보냅니다! 이 코드는 무료로 사용할 수 있지만, 코드를 재게시하는 경우 하우스 룰이 적용된다는 점을 기억하세요.
면책사항
해당 정보와 게시물은 금융, 투자, 트레이딩 또는 기타 유형의 조언이나 권장 사항으로 간주되지 않으며, 트레이딩뷰에서 제공하거나 보증하는 것이 아닙니다. 자세한 내용은 이용 약관을 참조하세요.
오픈 소스 스크립트
트레이딩뷰의 진정한 정신에 따라, 이 스크립트의 작성자는 이를 오픈소스로 공개하여 트레이더들이 기능을 검토하고 검증할 수 있도록 했습니다. 작성자에게 찬사를 보냅니다! 이 코드는 무료로 사용할 수 있지만, 코드를 재게시하는 경우 하우스 룰이 적용된다는 점을 기억하세요.
면책사항
해당 정보와 게시물은 금융, 투자, 트레이딩 또는 기타 유형의 조언이나 권장 사항으로 간주되지 않으며, 트레이딩뷰에서 제공하거나 보증하는 것이 아닙니다. 자세한 내용은 이용 약관을 참조하세요.