OPEN-SOURCE SCRIPT
업데이트됨 Parabolic SAR with alerts

This is Parabolic SAR with alerts built-in.
릴리즈 노트
This script is a custom implementation of the Parabolic SAR (Stop and Reverse) technical indicator, designed to provide potential 'buy' and 'sell' signals.
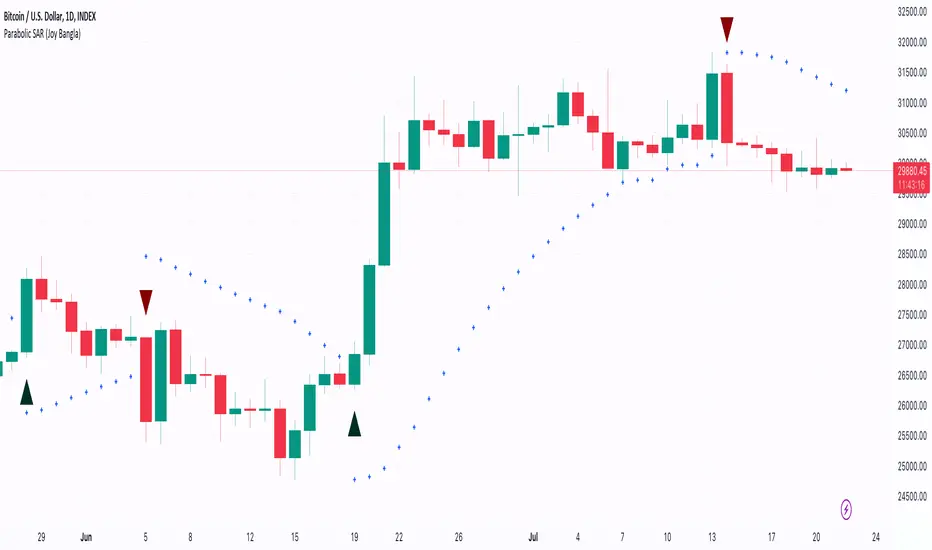
It first calculates the Parabolic SAR using a start value of 0.02, an increment of 0.02, and a maximum value of 0.2. The resulting Parabolic SAR values are then plotted with blue cross-style markers on the chart.
The script identifies bullish and bearish signals based on the relationship between the Parabolic SAR and the high and low prices:
- Bullish Signal: If the Parabolic SAR is below the current high and above the previous low, a green triangle pointing upward is plotted below the bar. This is seen as a potential 'buy' signal, and an alert titled 'Buy SAR' is set to trigger at this condition.
- Bearish Signal: If the Parabolic SAR is above the current low and below the previous high, a red triangle pointing downward is plotted above the bar. This is seen as a potential 'sell' signal, and an alert titled 'Sell SAR' is set to trigger at this condition.
This custom Parabolic SAR indicator offers a visual and alert-based method for identifying potential trading signals, making it a helpful tool for traders seeking to use it in their trading strategy.
Please note that, like all technical analysis tools, this indicator should be used in conjunction with other forms of analysis and is not meant to provide buy or sell signals.
Always conduct your own analysis and consult a financial advisor before trading.
오픈 소스 스크립트
트레이딩뷰의 진정한 정신에 따라, 이 스크립트의 작성자는 이를 오픈소스로 공개하여 트레이더들이 기능을 검토하고 검증할 수 있도록 했습니다. 작성자에게 찬사를 보냅니다! 이 코드는 무료로 사용할 수 있지만, 코드를 재게시하는 경우 하우스 룰이 적용된다는 점을 기억하세요.
For guides on how to use the Aladdin indicator or how to buy it, please check joy-bangla.gitbook.io/aladdin/
면책사항
해당 정보와 게시물은 금융, 투자, 트레이딩 또는 기타 유형의 조언이나 권장 사항으로 간주되지 않으며, 트레이딩뷰에서 제공하거나 보증하는 것이 아닙니다. 자세한 내용은 이용 약관을 참조하세요.