OPEN-SOURCE SCRIPT
Bollinger Bands %B + ATR
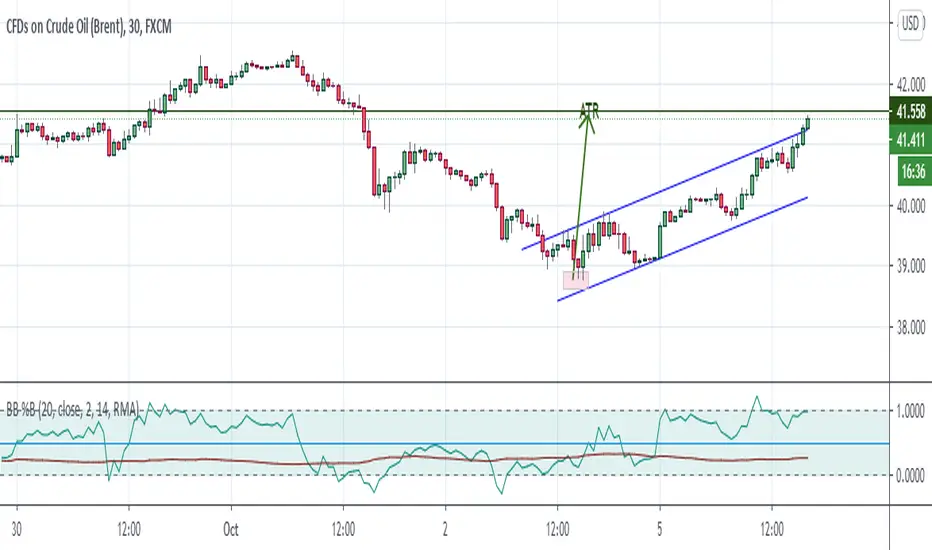
This indicator is best suitable for the 30-minutes interval OIL charts, due to ATR accuracy.
BB%B is great for showing oversold/overbought market conditions and offers excellent entry/exit opportunities for Day Trading (30 minutes chart), as well as reliable convergence/divergence patterns. ATR is conveniently combined and shows potential market volatility levels for the day when used in 30-minutes charts, thus demarcating your day trade exit point.
To use the ATR on this indicator: Just read the ATR value of the lowest (for a new bull trend) or the highest (for a new bear trend) candlestick of the newly formed trend leg. Let's suppose the ATR reads 0.2891, then you project a move of 2.891 points towards the given trend direction using the ruler tool (30-minutes charts). That's all, and there you have your take profit target!
Good Luck!!!
오픈 소스 스크립트
트레이딩뷰의 진정한 정신에 따라, 이 스크립트의 작성자는 이를 오픈소스로 공개하여 트레이더들이 기능을 검토하고 검증할 수 있도록 했습니다. 작성자에게 찬사를 보냅니다! 이 코드는 무료로 사용할 수 있지만, 코드를 재게시하는 경우 하우스 룰이 적용된다는 점을 기억하세요.
면책사항
해당 정보와 게시물은 금융, 투자, 트레이딩 또는 기타 유형의 조언이나 권장 사항으로 간주되지 않으며, 트레이딩뷰에서 제공하거나 보증하는 것이 아닙니다. 자세한 내용은 이용 약관을 참조하세요.
오픈 소스 스크립트
트레이딩뷰의 진정한 정신에 따라, 이 스크립트의 작성자는 이를 오픈소스로 공개하여 트레이더들이 기능을 검토하고 검증할 수 있도록 했습니다. 작성자에게 찬사를 보냅니다! 이 코드는 무료로 사용할 수 있지만, 코드를 재게시하는 경우 하우스 룰이 적용된다는 점을 기억하세요.
면책사항
해당 정보와 게시물은 금융, 투자, 트레이딩 또는 기타 유형의 조언이나 권장 사항으로 간주되지 않으며, 트레이딩뷰에서 제공하거나 보증하는 것이 아닙니다. 자세한 내용은 이용 약관을 참조하세요.