PROTECTED SOURCE SCRIPT
업데이트됨 NEoWave Chart
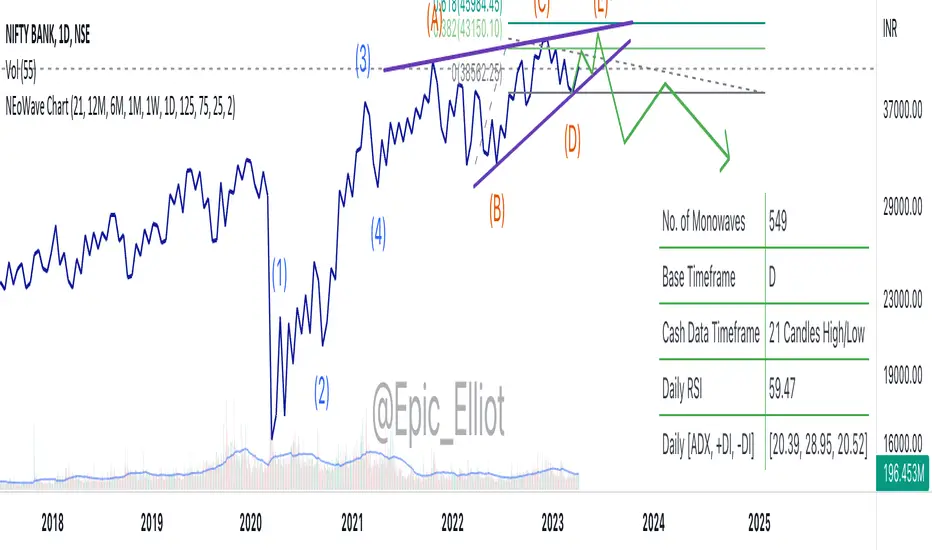
This is the indicator used to plot cash data chart for NEoWave analysis.
How to use:
How to use:
- Apply the indicator on the chart.
- Select timeframe on your chart.
- The indicator will automatically select default cash data timeframe and will plot chart accordingly. If you like to change the cash data timeframe, these is an option to select from dropdown.
릴리즈 노트
I have added various features in this update like, selecting cash data timeframe based on number of candles or in-build timeframe, updated table content. Though, cash data chart based on in-built timeframe will work on certain timeframes only, as other timeframes does not equally divide.릴리즈 노트
1 Cash data chart based on number of candles. Number of candles to be used for the chart may be selected from dropdown menu2 Cash data chart also available based on inbuilt timeframes, but limited to some specific timeframes only. Custom timeframe may be selected from dropdown menu.
3 Cash data timeframe divider included, may be selected/unselected in the menu.
4 First and last monowaves improved.
5 Candlestick chart also added. Transparency may be changed in the style menu.
릴리즈 노트
RSI and ADX values based on daily timeframe added보호된 스크립트입니다
이 스크립트는 비공개 소스로 게시됩니다. 하지만 이를 자유롭게 제한 없이 사용할 수 있습니다 – 자세한 내용은 여기에서 확인하세요.
면책사항
해당 정보와 게시물은 금융, 투자, 트레이딩 또는 기타 유형의 조언이나 권장 사항으로 간주되지 않으며, 트레이딩뷰에서 제공하거나 보증하는 것이 아닙니다. 자세한 내용은 이용 약관을 참조하세요.
보호된 스크립트입니다
이 스크립트는 비공개 소스로 게시됩니다. 하지만 이를 자유롭게 제한 없이 사용할 수 있습니다 – 자세한 내용은 여기에서 확인하세요.
면책사항
해당 정보와 게시물은 금융, 투자, 트레이딩 또는 기타 유형의 조언이나 권장 사항으로 간주되지 않으며, 트레이딩뷰에서 제공하거나 보증하는 것이 아닙니다. 자세한 내용은 이용 약관을 참조하세요.