PROTECTED SOURCE SCRIPT
업데이트됨 Super Smart v1
Here’s a full breakdown of its **features and options** grouped by function 👇
---
## 🧩 1. **User Inputs (Settings Menu)**
These are the configurable options visible in the TradingView indicator settings:
### **EMA Settings**
| Parameter | Default | Description |
| ------------- | ------- | ------------------------------------- |
| `emaShortLen` | 20 | Main fast EMA length |
| `emaLongLen` | 50 | Main slow EMA length |
| `emaExtraLen` | 100 | Extra (longer-term) EMA length |
| `smmaLen` | 14 | SMMA (Smoothed Moving Average) period |
### **Extra EMA Option**
| Parameter | Default | Description |
| ------------- | ------- | ----------------------------------------- |
| `useExtraEMA` | ✅ true | Enables additional EMA 9/21 cross signals |
### **RSI Settings**
| Parameter | Default | Description |
| ------------- | ------- | ---------------------------- |
| `rsiPeriod` | 14 | RSI period |
| `overbought` | 70 | RSI overbought threshold |
| `oversold` | 30 | RSI oversold threshold |
| `divLookback` | 5 | RSI divergence lookback bars |
### **Fibonacci Settings**
| Parameter | Default | Description |
| ----------------- | ------- | --------------------------------------------------------- |
| `fibLookbackBars` | 100 | Bars to look back for Fib high/low |
| `fibTolerance` | 0.01 | How close price must be to a Fib level to count as “near” |
### **Dashboard Settings**
| Parameter | Default | Options |
| ----------------- | ----------- | ------------------------------------------------------ |
| `dashboardPosOpt` | "Top Right" | “Top Left”, “Top Right”, “Bottom Left”, “Bottom Right” |
---
## 📊 2. **Indicators Calculated**
The script calculates and plots several core technical indicators:
* **EMA 20**, **EMA 50**, **EMA 100**
* **SMMA 14**
* **VWAP**
* *(Optional)* **EMA 9** and **EMA 21** (for secondary cross signals)
* **RSI (14)** with thresholds at 30, 50, and 70
* **Fibonacci retracement levels** (0.236 → 0.886 range)
* **RSI Divergences** (bullish and bearish)
* **External SMA(10) crossover signals**
---
## ⚙️ 3. **Trading Conditions**
These generate the **buy/sell signals**:
| Signal | Logic Summary |
| -------------------- | ------------------------------------------------------------------------------------------------------------ |
| **Super Smart Buy** | Bullish trend (EMA20 > EMA50, price > VWAP), price above SMMA, RSI or EMA cross or SMA cross, near Fib level |
| **Super Smart Sell** | Bearish trend (EMA20 < EMA50, price < VWAP), price below SMMA, RSI or EMA cross or SMA cross, near Fib level |
| **BOOST Buy** | Super Smart Buy + RSI momentum > 50 or bullish RSI divergence |
| **BOOST Sell** | Super Smart Sell + RSI momentum < 50 or bearish RSI divergence |
Each condition has its own **plotshape** (visual icon on chart).
---
## 💪 4. **Signal Strength Calculation**
The indicator computes a **“Signal Strength”** percentage (0–100%) based on eight contributing factors:
1. Trend direction (EMA20 vs EMA50, and VWAP relation)
2. EMA9/21 cross
3. SMMA position
4. RSI crossovers
5. RSI momentum
6. Divergences
7. Fibonacci proximity
The result is shown on the dashboard with a **color gradient**:
* **Green** → Strong signal (≥71%)
* **Orange** → Medium strength (31–70%)
* **Red** → Weak (<30%)
---
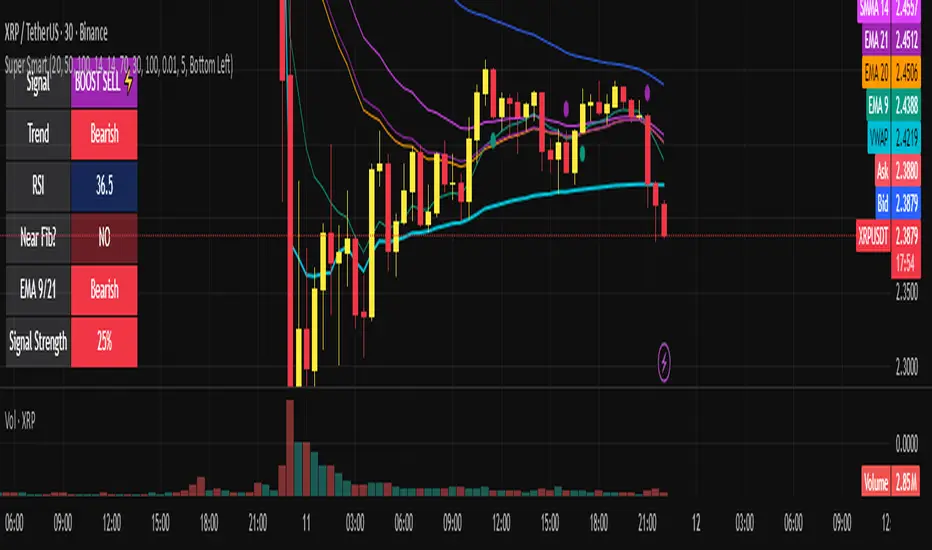
## 🧭 5. **Dashboard Display**
The built-in dashboard shows:
| Row | Label | Displayed Info |
| --- | ------------------- | --------------------------------------------------------------------------- |
| 1 | **Signal** | “SMART BUY ✅”, “BOOST BUY 🚀”, “SMART SELL ⛔”, “BOOST SELL ⚡”, or “NEUTRAL” |
| 2 | **Trend** | “Bullish”, “Bearish”, or “Sideways” |
| 3 | **RSI** | Current RSI value |
| 4 | **Near Fib?** | YES/NO |
| 5 | **EMA 9/21** | Bullish / Bearish / Disabled |
| 6 | **Signal Strength** | % (with color-coded background) |
Dashboard position is user-selectable (corners of the chart).
---
## 🟢 6. **Visual Plot Elements**
* EMA lines (20/50/100)
* SMMA line
* VWAP line
* Optional EMA9/21 lines
* Buy/Sell arrows:
* 🔼 **Green** = Smart Buy
* 🔽 **Red** = Smart Sell
* 🚀 **Aqua** = Boost Buy
* ⚡ **Purple** = Boost Sell
* Small circles for EMA9/21 crosses
---
## 🧠 7. **Summary of Features**
✅ Multi-timeframe EMA strategy
✅ RSI + Divergence detection
✅ Fibonacci confluence detection
✅ VWAP-based trend filtering
✅ Dynamic signal strength meter
✅ “Boost” (enhanced) signal logic
✅ Visual dashboard (movable)
✅ Extra EMA 9/21 system toggle
---
┌────────────────────────┐
│ MARKET DATA (price) │
└──────────┬─────────────┘
│
▼
┌──────────────────────────────────────────────┐
│ CORE INDICATORS │
├──────────────────────────────────────────────┤
│ EMA20 / EMA50 / EMA100 / EMA9 / EMA21 │
│ SMMA14 │
│ VWAP │
│ RSI (14) │
│ Fibonacci Levels (Lookback 100 bars) │
│ RSI Divergences │
│ SMA10 (for external crossover) │
└──────────────────────────────────────────────┘
│
▼
┌──────────────────────────────────────────────┐
│ TREND FILTERS │
├──────────────────────────────────────────────┤
│ Bullish Trend: EMA20 > EMA50 AND close > VWAP│
│ Bearish Trend: EMA20 < EMA50 AND close < VWAP│
│ Above SMMA14 → Bullish bias │
│ Below SMMA14 → Bearish bias │
└──────────────────────────────────────────────┘
│
▼
┌──────────────────────────────────────────────┐
│ ENTRY TRIGGERS │
├──────────────────────────────────────────────┤
│ RSI Crosses: │
│ - Overbought (Sell) │
│ - Oversold (Buy) │
│ - Midline 50 momentum crosses │
│ EMA Crosses: │
│ - EMA20/50 Bull or Bear │
│ - (Optional) EMA9/21 Bull or Bear │
│ External SMA10 crossover │
│ Fibonacci proximity (near key retrace level) │
│ RSI Divergence (Bullish or Bearish) │
└──────────────────────────────────────────────┘
│
▼
┌──────────────────────────────────────────────┐
│ SUPER SMART BASE SIGNALS │
├──────────────────────────────────────────────┤
│ SMART BUY = BullTrend + AboveSMMA + │
│ (RSI Buy OR EMA Cross OR SMA X) │
│ + Near Fibonacci Level │
│ │
│ SMART SELL = BearTrend + BelowSMMA + │
│ (RSI Sell OR EMA Cross OR SMA X)│
│ + Near Fibonacci Level │
└──────────────────────────────────────────────┘
│
▼
┌──────────────────────────────────────────────┐
│ BOOST CONFIRMATIONS │
├──────────────────────────────────────────────┤
│ BOOST BUY = SMART BUY + (RSI>50 OR BullDiv) │
│ BOOST SELL = SMART SELL + (RSI<50 OR BearDiv)│
└──────────────────────────────────────────────┘
│
▼
┌──────────────────────────────────────────────┐
│ SIGNAL STRENGTH CALCULATION (0–100%) │
├──────────────────────────────────────────────┤
│ Points added for: │
│ - Trend alignment │
│ - EMA crosses │
│ - SMMA position │
│ - RSI momentum │
│ - Divergence │
│ - Near Fibonacci │
│ Output = (Total / Max 8) × 100% │
└──────────────────────────────────────────────┘
│
▼
┌──────────────────────────────────────────────┐
│ DASHBOARD │
├──────────────────────────────────────────────┤
│ Displays: │
│ - Signal Type (Buy/Sell/Boost/Neutral) │
│ - Trend Direction │
│ - RSI Value │
│ - Near Fib (Yes/No) │
│ - EMA 9/21 Status │
│ - Signal Strength (%) + Color Gradient │
│ Position: user-selectable (corner) │
└──────────────────────────────────────────────┘
---
## 🧩 1. **User Inputs (Settings Menu)**
These are the configurable options visible in the TradingView indicator settings:
### **EMA Settings**
| Parameter | Default | Description |
| ------------- | ------- | ------------------------------------- |
| `emaShortLen` | 20 | Main fast EMA length |
| `emaLongLen` | 50 | Main slow EMA length |
| `emaExtraLen` | 100 | Extra (longer-term) EMA length |
| `smmaLen` | 14 | SMMA (Smoothed Moving Average) period |
### **Extra EMA Option**
| Parameter | Default | Description |
| ------------- | ------- | ----------------------------------------- |
| `useExtraEMA` | ✅ true | Enables additional EMA 9/21 cross signals |
### **RSI Settings**
| Parameter | Default | Description |
| ------------- | ------- | ---------------------------- |
| `rsiPeriod` | 14 | RSI period |
| `overbought` | 70 | RSI overbought threshold |
| `oversold` | 30 | RSI oversold threshold |
| `divLookback` | 5 | RSI divergence lookback bars |
### **Fibonacci Settings**
| Parameter | Default | Description |
| ----------------- | ------- | --------------------------------------------------------- |
| `fibLookbackBars` | 100 | Bars to look back for Fib high/low |
| `fibTolerance` | 0.01 | How close price must be to a Fib level to count as “near” |
### **Dashboard Settings**
| Parameter | Default | Options |
| ----------------- | ----------- | ------------------------------------------------------ |
| `dashboardPosOpt` | "Top Right" | “Top Left”, “Top Right”, “Bottom Left”, “Bottom Right” |
---
## 📊 2. **Indicators Calculated**
The script calculates and plots several core technical indicators:
* **EMA 20**, **EMA 50**, **EMA 100**
* **SMMA 14**
* **VWAP**
* *(Optional)* **EMA 9** and **EMA 21** (for secondary cross signals)
* **RSI (14)** with thresholds at 30, 50, and 70
* **Fibonacci retracement levels** (0.236 → 0.886 range)
* **RSI Divergences** (bullish and bearish)
* **External SMA(10) crossover signals**
---
## ⚙️ 3. **Trading Conditions**
These generate the **buy/sell signals**:
| Signal | Logic Summary |
| -------------------- | ------------------------------------------------------------------------------------------------------------ |
| **Super Smart Buy** | Bullish trend (EMA20 > EMA50, price > VWAP), price above SMMA, RSI or EMA cross or SMA cross, near Fib level |
| **Super Smart Sell** | Bearish trend (EMA20 < EMA50, price < VWAP), price below SMMA, RSI or EMA cross or SMA cross, near Fib level |
| **BOOST Buy** | Super Smart Buy + RSI momentum > 50 or bullish RSI divergence |
| **BOOST Sell** | Super Smart Sell + RSI momentum < 50 or bearish RSI divergence |
Each condition has its own **plotshape** (visual icon on chart).
---
## 💪 4. **Signal Strength Calculation**
The indicator computes a **“Signal Strength”** percentage (0–100%) based on eight contributing factors:
1. Trend direction (EMA20 vs EMA50, and VWAP relation)
2. EMA9/21 cross
3. SMMA position
4. RSI crossovers
5. RSI momentum
6. Divergences
7. Fibonacci proximity
The result is shown on the dashboard with a **color gradient**:
* **Green** → Strong signal (≥71%)
* **Orange** → Medium strength (31–70%)
* **Red** → Weak (<30%)
---
## 🧭 5. **Dashboard Display**
The built-in dashboard shows:
| Row | Label | Displayed Info |
| --- | ------------------- | --------------------------------------------------------------------------- |
| 1 | **Signal** | “SMART BUY ✅”, “BOOST BUY 🚀”, “SMART SELL ⛔”, “BOOST SELL ⚡”, or “NEUTRAL” |
| 2 | **Trend** | “Bullish”, “Bearish”, or “Sideways” |
| 3 | **RSI** | Current RSI value |
| 4 | **Near Fib?** | YES/NO |
| 5 | **EMA 9/21** | Bullish / Bearish / Disabled |
| 6 | **Signal Strength** | % (with color-coded background) |
Dashboard position is user-selectable (corners of the chart).
---
## 🟢 6. **Visual Plot Elements**
* EMA lines (20/50/100)
* SMMA line
* VWAP line
* Optional EMA9/21 lines
* Buy/Sell arrows:
* 🔼 **Green** = Smart Buy
* 🔽 **Red** = Smart Sell
* 🚀 **Aqua** = Boost Buy
* ⚡ **Purple** = Boost Sell
* Small circles for EMA9/21 crosses
---
## 🧠 7. **Summary of Features**
✅ Multi-timeframe EMA strategy
✅ RSI + Divergence detection
✅ Fibonacci confluence detection
✅ VWAP-based trend filtering
✅ Dynamic signal strength meter
✅ “Boost” (enhanced) signal logic
✅ Visual dashboard (movable)
✅ Extra EMA 9/21 system toggle
---
┌────────────────────────┐
│ MARKET DATA (price) │
└──────────┬─────────────┘
│
▼
┌──────────────────────────────────────────────┐
│ CORE INDICATORS │
├──────────────────────────────────────────────┤
│ EMA20 / EMA50 / EMA100 / EMA9 / EMA21 │
│ SMMA14 │
│ VWAP │
│ RSI (14) │
│ Fibonacci Levels (Lookback 100 bars) │
│ RSI Divergences │
│ SMA10 (for external crossover) │
└──────────────────────────────────────────────┘
│
▼
┌──────────────────────────────────────────────┐
│ TREND FILTERS │
├──────────────────────────────────────────────┤
│ Bullish Trend: EMA20 > EMA50 AND close > VWAP│
│ Bearish Trend: EMA20 < EMA50 AND close < VWAP│
│ Above SMMA14 → Bullish bias │
│ Below SMMA14 → Bearish bias │
└──────────────────────────────────────────────┘
│
▼
┌──────────────────────────────────────────────┐
│ ENTRY TRIGGERS │
├──────────────────────────────────────────────┤
│ RSI Crosses: │
│ - Overbought (Sell) │
│ - Oversold (Buy) │
│ - Midline 50 momentum crosses │
│ EMA Crosses: │
│ - EMA20/50 Bull or Bear │
│ - (Optional) EMA9/21 Bull or Bear │
│ External SMA10 crossover │
│ Fibonacci proximity (near key retrace level) │
│ RSI Divergence (Bullish or Bearish) │
└──────────────────────────────────────────────┘
│
▼
┌──────────────────────────────────────────────┐
│ SUPER SMART BASE SIGNALS │
├──────────────────────────────────────────────┤
│ SMART BUY = BullTrend + AboveSMMA + │
│ (RSI Buy OR EMA Cross OR SMA X) │
│ + Near Fibonacci Level │
│ │
│ SMART SELL = BearTrend + BelowSMMA + │
│ (RSI Sell OR EMA Cross OR SMA X)│
│ + Near Fibonacci Level │
└──────────────────────────────────────────────┘
│
▼
┌──────────────────────────────────────────────┐
│ BOOST CONFIRMATIONS │
├──────────────────────────────────────────────┤
│ BOOST BUY = SMART BUY + (RSI>50 OR BullDiv) │
│ BOOST SELL = SMART SELL + (RSI<50 OR BearDiv)│
└──────────────────────────────────────────────┘
│
▼
┌──────────────────────────────────────────────┐
│ SIGNAL STRENGTH CALCULATION (0–100%) │
├──────────────────────────────────────────────┤
│ Points added for: │
│ - Trend alignment │
│ - EMA crosses │
│ - SMMA position │
│ - RSI momentum │
│ - Divergence │
│ - Near Fibonacci │
│ Output = (Total / Max 8) × 100% │
└──────────────────────────────────────────────┘
│
▼
┌──────────────────────────────────────────────┐
│ DASHBOARD │
├──────────────────────────────────────────────┤
│ Displays: │
│ - Signal Type (Buy/Sell/Boost/Neutral) │
│ - Trend Direction │
│ - RSI Value │
│ - Near Fib (Yes/No) │
│ - EMA 9/21 Status │
│ - Signal Strength (%) + Color Gradient │
│ Position: user-selectable (corner) │
└──────────────────────────────────────────────┘
릴리즈 노트
small update.릴리즈 노트
small update보호된 스크립트입니다
이 스크립트는 비공개 소스로 게시됩니다. 하지만 제한 없이 자유롭게 사용할 수 있습니다 — 여기에서 자세히 알아보기.
면책사항
이 정보와 게시물은 TradingView에서 제공하거나 보증하는 금융, 투자, 거래 또는 기타 유형의 조언이나 권고 사항을 의미하거나 구성하지 않습니다. 자세한 내용은 이용 약관을 참고하세요.
면책사항
이 정보와 게시물은 TradingView에서 제공하거나 보증하는 금융, 투자, 거래 또는 기타 유형의 조언이나 권고 사항을 의미하거나 구성하지 않습니다. 자세한 내용은 이용 약관을 참고하세요.