OPEN-SOURCE SCRIPT
Shadow Edge (Example)

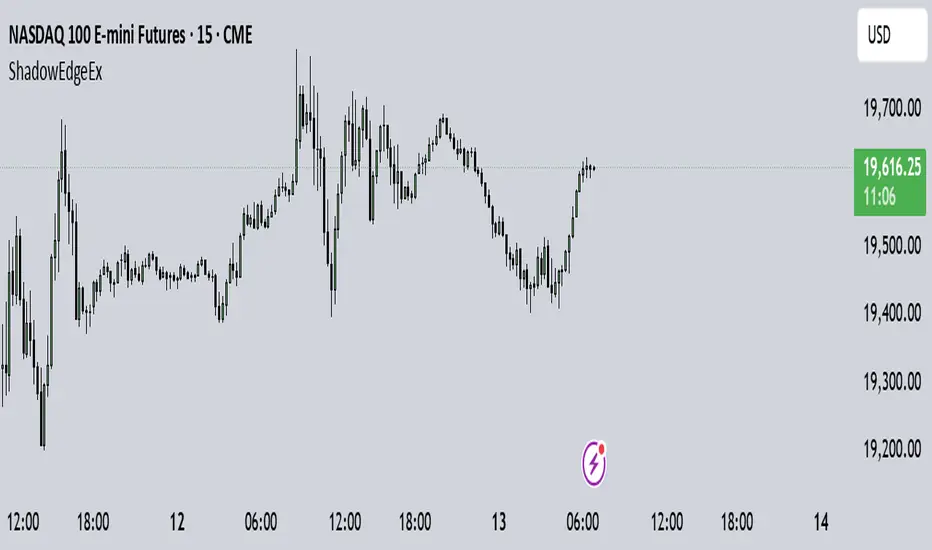
This script tracks hourly price extremes (highs/lows) and their equilibrium (midpoint), plotting them as dynamic reference lines on your chart. It helps visualize intraday support/resistance levels and potential price boundaries.
Key Features
Previous Hour Levels (Static Lines):
PH (Previous Hour High): Red line.
PL (Previous Hour Low): Green line.
P.EQ (Previous Hour Equilibrium): Blue midpoint between PH and PL.
Current Hour Levels (Dynamic/Dotted Lines):
MuEH (Current Hour High): Yellow dashed line (updates in real-time).
MuEL (Current Hour Low): Orange dashed line (updates in real-time).
Labels: Clear text labels on the right edge of the chart for easy readability.
How It Works
Hourly Tracking:
Detects new hours using the hour(time) function.
Resets high/low values at the start of each hour.
Stores the previous hour’s PH, PL, and P.EQ when a new hour begins.
Dynamic Updates:
Continuously updates MuEH and MuEL during the current hour to reflect the latest extremes.
Customization
Toggle visibility of lines via inputs:
Enable/disable PH, PL, P.EQ, MuEH, MuEL individually.
Adjustable colors and line styles (solid for previous hour, dashed for current hour).
Use Case
Intraday Traders: Identify hourly ranges, breakout/retracement opportunities, or mean-reversion setups.
Visual Reference: Quickly see where price is relative to recent hourly activity.
Technical Notes
Overlay: Plots directly on the price chart.
Efficiency: Uses var variables to preserve values between bars.
Labels: Only appear on the latest bar to avoid clutter.
This tool simplifies intraday price action analysis by combining historical and real-time hourly data into a single visual framework.
오픈 소스 스크립트
트레이딩뷰의 진정한 정신에 따라, 이 스크립트의 작성자는 이를 오픈소스로 공개하여 트레이더들이 기능을 검토하고 검증할 수 있도록 했습니다. 작성자에게 찬사를 보냅니다! 이 코드는 무료로 사용할 수 있지만, 코드를 재게시하는 경우 하우스 룰이 적용된다는 점을 기억하세요.
면책사항
해당 정보와 게시물은 금융, 투자, 트레이딩 또는 기타 유형의 조언이나 권장 사항으로 간주되지 않으며, 트레이딩뷰에서 제공하거나 보증하는 것이 아닙니다. 자세한 내용은 이용 약관을 참조하세요.
오픈 소스 스크립트
트레이딩뷰의 진정한 정신에 따라, 이 스크립트의 작성자는 이를 오픈소스로 공개하여 트레이더들이 기능을 검토하고 검증할 수 있도록 했습니다. 작성자에게 찬사를 보냅니다! 이 코드는 무료로 사용할 수 있지만, 코드를 재게시하는 경우 하우스 룰이 적용된다는 점을 기억하세요.
면책사항
해당 정보와 게시물은 금융, 투자, 트레이딩 또는 기타 유형의 조언이나 권장 사항으로 간주되지 않으며, 트레이딩뷰에서 제공하거나 보증하는 것이 아닙니다. 자세한 내용은 이용 약관을 참조하세요.