OPEN-SOURCE SCRIPT
volatility-weighted price change divergence
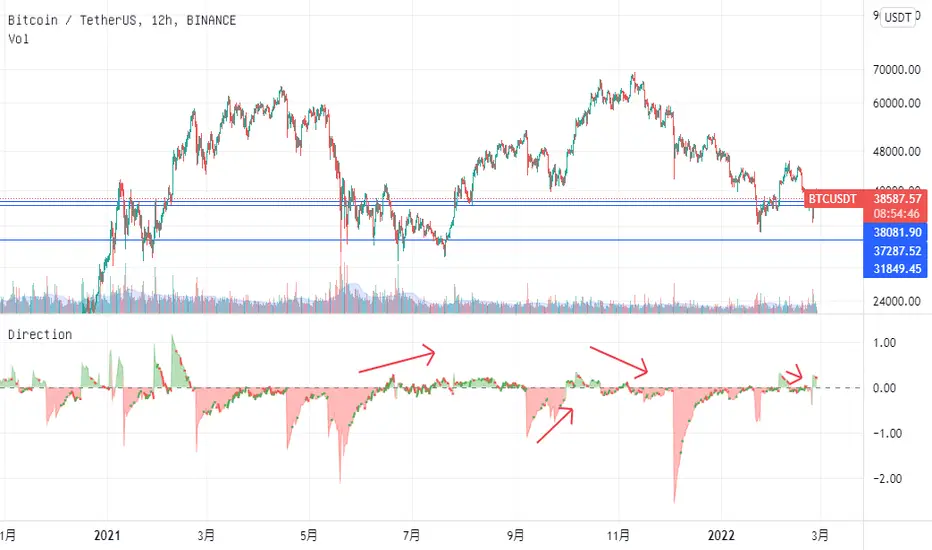
EMA of intrabar-volatility-weighted price change minus EMA of price change. It puts more weights on candles that have large volatility inside, and assumes that the direction of those high-volatility candles are more meaningful than low-volatility ones. Therefore, we take the difference between the volatility-weighted price change and the regular price change and plot the EMA. The indicator may be used as a tool to find divergence and potential reversal, or hints of continuation of a strong trend. Note that this indicator can change a lot with different time frames and settings, so take care to backtest before using. Recommended settings are 15m resolution for time frames longer than 4H and 1m resolution (with 200 EMA length) for time frames below 4H. The resolution is used to find the intrabar volatility.
오픈 소스 스크립트
트레이딩뷰의 진정한 정신에 따라, 이 스크립트의 작성자는 이를 오픈소스로 공개하여 트레이더들이 기능을 검토하고 검증할 수 있도록 했습니다. 작성자에게 찬사를 보냅니다! 이 코드는 무료로 사용할 수 있지만, 코드를 재게시하는 경우 하우스 룰이 적용된다는 점을 기억하세요.
면책사항
해당 정보와 게시물은 금융, 투자, 트레이딩 또는 기타 유형의 조언이나 권장 사항으로 간주되지 않으며, 트레이딩뷰에서 제공하거나 보증하는 것이 아닙니다. 자세한 내용은 이용 약관을 참조하세요.
오픈 소스 스크립트
트레이딩뷰의 진정한 정신에 따라, 이 스크립트의 작성자는 이를 오픈소스로 공개하여 트레이더들이 기능을 검토하고 검증할 수 있도록 했습니다. 작성자에게 찬사를 보냅니다! 이 코드는 무료로 사용할 수 있지만, 코드를 재게시하는 경우 하우스 룰이 적용된다는 점을 기억하세요.
면책사항
해당 정보와 게시물은 금융, 투자, 트레이딩 또는 기타 유형의 조언이나 권장 사항으로 간주되지 않으며, 트레이딩뷰에서 제공하거나 보증하는 것이 아닙니다. 자세한 내용은 이용 약관을 참조하세요.