OPEN-SOURCE SCRIPT
Adaptive Moving Average
what is the purpose of the indicator?
When short-length moving averages are used as trailing stops, they cause exiting the trade too early. Keeping the length value too high will result in exiting the transaction too late and losing most of the profits earned. I aimed to prevent this problem with this indicator.
what is "Adaptive Moving Average"?
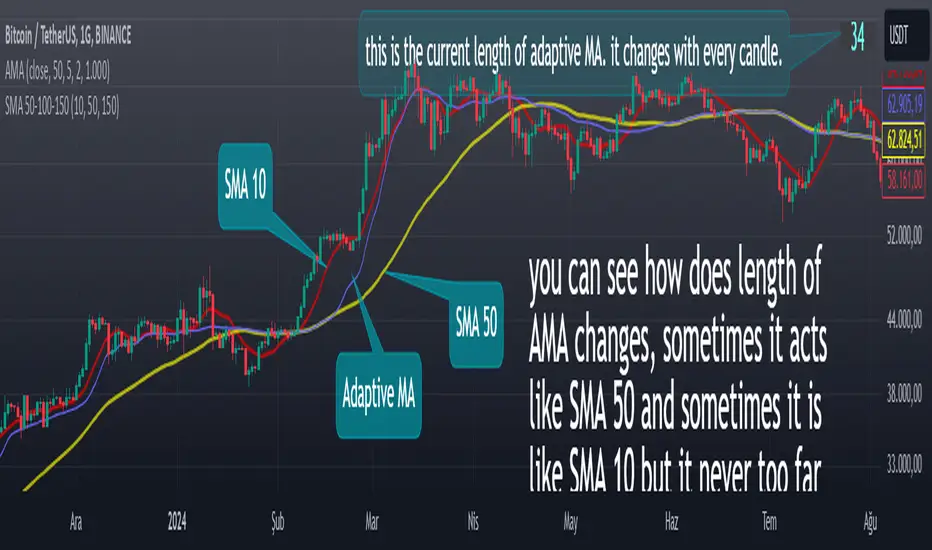
it is a moving average that can change its length on each candle depending on the selected source.
what it does?
The indicator first finds the average lengths of the existing candles and defines different distances accordingly. When the moving average drawn by the indicator enters the area defined as "far" by the indicator, the indicator reduces the length of the moving average, preventing it from moving too far from the price, and continues to do so at different rates until the moving average gets close enough to the price. If the moving average gets close enough to the price, it starts to increase the length of the average and thus the adaptation continues.
how it does it?
Since the change of each trading pair is different in percentage terms, I chose to base the average height of the candles instead of using constant percentage values to define the concept of "far". While doing this, I used a weighted moving average so that the system could quickly adapt to the latest changes (you can see it on line 17). After calculating what percentage of the moving average this value is, I caused the length of the moving average to change in each bar depending on the multiples of this percentage value that the price moved away from the average (look at line 20, 21 and 22). Finally, I created a new moving average using this new length value I obtained.
how to use it?
Although the indicator chooses its own length, we have some inputs to customize it. First of all, we can choose which source we will use the moving average on. The "source" input allows us to use it with other indicators.
"max length" and "min length" determine the maximum and minimum value that the length of the moving average can take.
Apart from this, there are options for you to add a standard moving average to the chart so that you can compare the adaptive moving average, and bollinger band channels that you can use to create different strategies.
This indicator was developed due to the need for a more sophisticated trailing stop, but once you understand how it works, it is completely up to you to combine it with other indicators and create different strategies.
When short-length moving averages are used as trailing stops, they cause exiting the trade too early. Keeping the length value too high will result in exiting the transaction too late and losing most of the profits earned. I aimed to prevent this problem with this indicator.
what is "Adaptive Moving Average"?
it is a moving average that can change its length on each candle depending on the selected source.
what it does?
The indicator first finds the average lengths of the existing candles and defines different distances accordingly. When the moving average drawn by the indicator enters the area defined as "far" by the indicator, the indicator reduces the length of the moving average, preventing it from moving too far from the price, and continues to do so at different rates until the moving average gets close enough to the price. If the moving average gets close enough to the price, it starts to increase the length of the average and thus the adaptation continues.
how it does it?
Since the change of each trading pair is different in percentage terms, I chose to base the average height of the candles instead of using constant percentage values to define the concept of "far". While doing this, I used a weighted moving average so that the system could quickly adapt to the latest changes (you can see it on line 17). After calculating what percentage of the moving average this value is, I caused the length of the moving average to change in each bar depending on the multiples of this percentage value that the price moved away from the average (look at line 20, 21 and 22). Finally, I created a new moving average using this new length value I obtained.
how to use it?
Although the indicator chooses its own length, we have some inputs to customize it. First of all, we can choose which source we will use the moving average on. The "source" input allows us to use it with other indicators.
"max length" and "min length" determine the maximum and minimum value that the length of the moving average can take.
Apart from this, there are options for you to add a standard moving average to the chart so that you can compare the adaptive moving average, and bollinger band channels that you can use to create different strategies.
This indicator was developed due to the need for a more sophisticated trailing stop, but once you understand how it works, it is completely up to you to combine it with other indicators and create different strategies.
오픈 소스 스크립트
트레이딩뷰의 진정한 정신에 따라, 이 스크립트의 작성자는 이를 오픈소스로 공개하여 트레이더들이 기능을 검토하고 검증할 수 있도록 했습니다. 작성자에게 찬사를 보냅니다! 이 코드는 무료로 사용할 수 있지만, 코드를 재게시하는 경우 하우스 룰이 적용된다는 점을 기억하세요.
면책사항
해당 정보와 게시물은 금융, 투자, 트레이딩 또는 기타 유형의 조언이나 권장 사항으로 간주되지 않으며, 트레이딩뷰에서 제공하거나 보증하는 것이 아닙니다. 자세한 내용은 이용 약관을 참조하세요.
오픈 소스 스크립트
트레이딩뷰의 진정한 정신에 따라, 이 스크립트의 작성자는 이를 오픈소스로 공개하여 트레이더들이 기능을 검토하고 검증할 수 있도록 했습니다. 작성자에게 찬사를 보냅니다! 이 코드는 무료로 사용할 수 있지만, 코드를 재게시하는 경우 하우스 룰이 적용된다는 점을 기억하세요.
면책사항
해당 정보와 게시물은 금융, 투자, 트레이딩 또는 기타 유형의 조언이나 권장 사항으로 간주되지 않으며, 트레이딩뷰에서 제공하거나 보증하는 것이 아닙니다. 자세한 내용은 이용 약관을 참조하세요.