OPEN-SOURCE SCRIPT
업데이트됨 RVol Over Time [vnhilton]
I recommend to do the following to give you indicator values at a better glance & for a cleaner chart: 1) Turn off labels on price scale. 2) Turn down opacity for Rvol-O-T down to 0%. 3) Move the indicator to the chart pane or to the volume pane. 4) Pin the indicator to scale A (same scale as the price chart/pane). Now you can only see the RVol-O-T on the top left.
Relative Volume (RVol) is an indicator that compares current volume with Average Daily Volume (ADV) for a set period of time. This can be used to find tickers in play, as those trading with an RVol >1 means it's trading above average volume, which may be worthy of your attention.
This indicator calculates RVol as the day progresses, which may be useful if you have strategies with an intraday criterion e.g. the ticker needs to be trading at Rvol > 2, 30 minutes after the open for stocks (You can see RVol in % or float form).
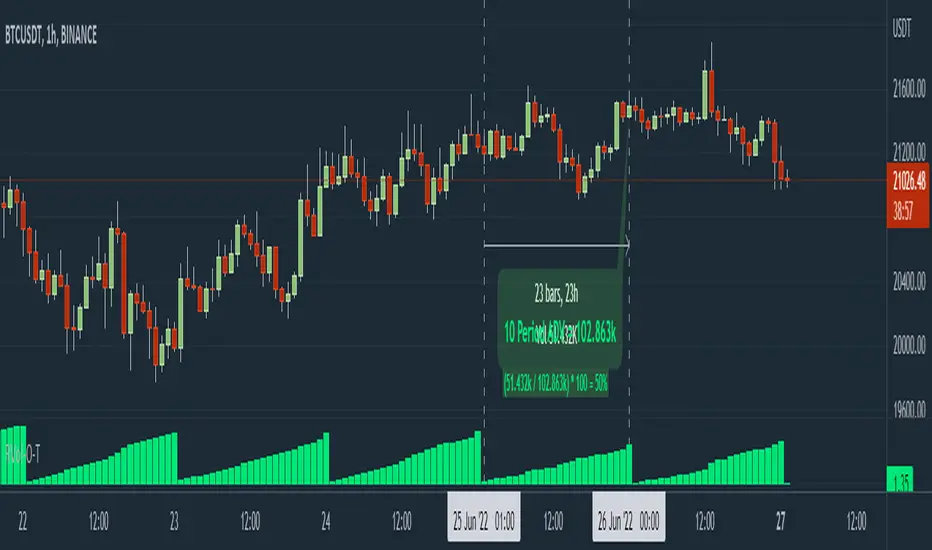
The chart snapshot image above shows BTCUSDT. Reason for this ticker is because for cryptocurrencies & forex pairs, market data is complete so this indicator can work correctly. If you try this indicator on stocks, indices or futures, you may notice that there's a discrepancy between daily volume candles & the summation of intraday candles (they don't equate each other - huge difference between the 2), causing the indicator to not work as effectively. To solve this problem, you would have to get extra market data from TradingView, or to integrate your broker with TradingView to pass along your broker's data feed (provided your broker also has real-time data - if not you may need to get extra market data via the broker).
Relative Volume (RVol) is an indicator that compares current volume with Average Daily Volume (ADV) for a set period of time. This can be used to find tickers in play, as those trading with an RVol >1 means it's trading above average volume, which may be worthy of your attention.
This indicator calculates RVol as the day progresses, which may be useful if you have strategies with an intraday criterion e.g. the ticker needs to be trading at Rvol > 2, 30 minutes after the open for stocks (You can see RVol in % or float form).
The chart snapshot image above shows BTCUSDT. Reason for this ticker is because for cryptocurrencies & forex pairs, market data is complete so this indicator can work correctly. If you try this indicator on stocks, indices or futures, you may notice that there's a discrepancy between daily volume candles & the summation of intraday candles (they don't equate each other - huge difference between the 2), causing the indicator to not work as effectively. To solve this problem, you would have to get extra market data from TradingView, or to integrate your broker with TradingView to pass along your broker's data feed (provided your broker also has real-time data - if not you may need to get extra market data via the broker).
릴리즈 노트
- Removed option to display RVol in % (float value I believe is superior when describing RVol e.g. 1x, 2x 3x average daily volume)- Change default plot style to line for aesthetics
- Added 3 RVol Multiple levels for quicker information on RVol
릴리즈 노트
- Added rate of change (1 period) colors for relative volume to see whether or not RVOL is accelerating/decelerating over time. Useful when sizing into trends with supporting accelerated RVOL, & taking profit when RVOL decelerates.릴리즈 노트
-Edited shorttitle-Added feature to choose ROC length for RVOL-OT
오픈 소스 스크립트
트레이딩뷰의 진정한 정신에 따라, 이 스크립트의 작성자는 이를 오픈소스로 공개하여 트레이더들이 기능을 검토하고 검증할 수 있도록 했습니다. 작성자에게 찬사를 보냅니다! 이 코드는 무료로 사용할 수 있지만, 코드를 재게시하는 경우 하우스 룰이 적용된다는 점을 기억하세요.
면책사항
해당 정보와 게시물은 금융, 투자, 트레이딩 또는 기타 유형의 조언이나 권장 사항으로 간주되지 않으며, 트레이딩뷰에서 제공하거나 보증하는 것이 아닙니다. 자세한 내용은 이용 약관을 참조하세요.
오픈 소스 스크립트
트레이딩뷰의 진정한 정신에 따라, 이 스크립트의 작성자는 이를 오픈소스로 공개하여 트레이더들이 기능을 검토하고 검증할 수 있도록 했습니다. 작성자에게 찬사를 보냅니다! 이 코드는 무료로 사용할 수 있지만, 코드를 재게시하는 경우 하우스 룰이 적용된다는 점을 기억하세요.
면책사항
해당 정보와 게시물은 금융, 투자, 트레이딩 또는 기타 유형의 조언이나 권장 사항으로 간주되지 않으며, 트레이딩뷰에서 제공하거나 보증하는 것이 아닙니다. 자세한 내용은 이용 약관을 참조하세요.