OPEN-SOURCE SCRIPT
Andean Oscillator (Version 3.0 Sr.K)
Andean Oscillator (Version 3.0 Sr.K)
This indicator is a momentum-based oscillator that measures the balance between bullish and bearish pressure.
🔧 How it works:
It calculates two adaptive envelopes around price and derives a "bullish" and "bearish" component.
The oscillator value is simply Bull - Bear, showing which side dominates.
A signal line (EMA of the oscillator) smooths the raw value.
Optionally, ±1σ levels are plotted to highlight statistically strong moves.
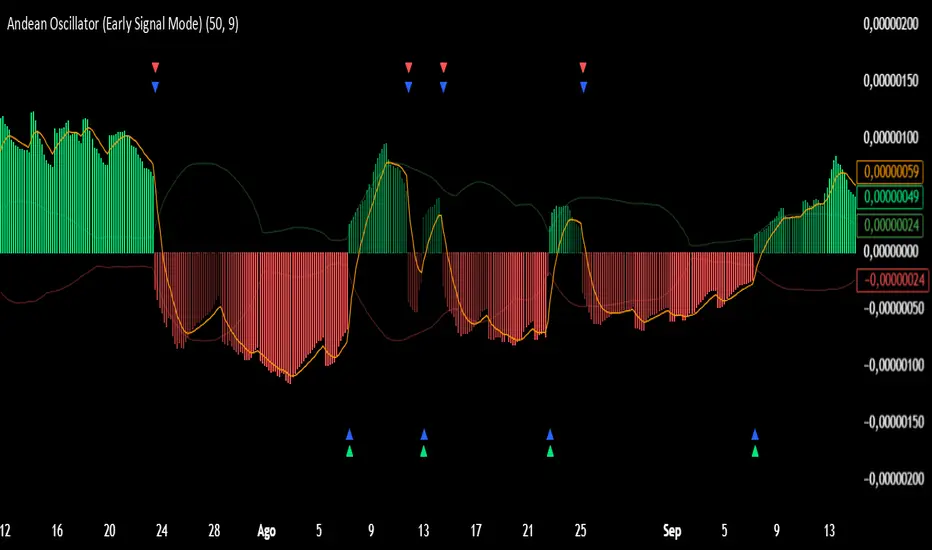
📊 What you see:
Histogram: Positive bars = bullish momentum, negative bars = bearish.
Orange Line: Signal line (EMA) used to confirm or anticipate reversals.
Zero Line: The equilibrium point. Crosses of this level signal a shift in market bias.
Green / Red Triangles: Buy and sell signals, either when crossing zero or crossing the signal line (depending on selected mode).
⚡ Early Signal Mode:
When enabled, signals trigger earlier — at the crossover between the oscillator and its signal line — allowing traders to enter potential reversals before a full zero-cross confirmation.
✅ Use cases:
Identify momentum shifts before price reversals.
Spot potential long/short setups with reduced lag.
Combine with price action or support/resistance for confirmation.
⚠️ Note: This is a tool for discretionary/manual trading. It does not open or close trades automatically. Always confirm with your own analysis and risk management.
This indicator is a momentum-based oscillator that measures the balance between bullish and bearish pressure.
🔧 How it works:
It calculates two adaptive envelopes around price and derives a "bullish" and "bearish" component.
The oscillator value is simply Bull - Bear, showing which side dominates.
A signal line (EMA of the oscillator) smooths the raw value.
Optionally, ±1σ levels are plotted to highlight statistically strong moves.
📊 What you see:
Histogram: Positive bars = bullish momentum, negative bars = bearish.
Orange Line: Signal line (EMA) used to confirm or anticipate reversals.
Zero Line: The equilibrium point. Crosses of this level signal a shift in market bias.
Green / Red Triangles: Buy and sell signals, either when crossing zero or crossing the signal line (depending on selected mode).
⚡ Early Signal Mode:
When enabled, signals trigger earlier — at the crossover between the oscillator and its signal line — allowing traders to enter potential reversals before a full zero-cross confirmation.
✅ Use cases:
Identify momentum shifts before price reversals.
Spot potential long/short setups with reduced lag.
Combine with price action or support/resistance for confirmation.
⚠️ Note: This is a tool for discretionary/manual trading. It does not open or close trades automatically. Always confirm with your own analysis and risk management.
오픈 소스 스크립트
트레이딩뷰의 진정한 정신에 따라, 이 스크립트의 작성자는 이를 오픈소스로 공개하여 트레이더들이 기능을 검토하고 검증할 수 있도록 했습니다. 작성자에게 찬사를 보냅니다! 이 코드는 무료로 사용할 수 있지만, 코드를 재게시하는 경우 하우스 룰이 적용된다는 점을 기억하세요.
면책사항
해당 정보와 게시물은 금융, 투자, 트레이딩 또는 기타 유형의 조언이나 권장 사항으로 간주되지 않으며, 트레이딩뷰에서 제공하거나 보증하는 것이 아닙니다. 자세한 내용은 이용 약관을 참조하세요.
오픈 소스 스크립트
트레이딩뷰의 진정한 정신에 따라, 이 스크립트의 작성자는 이를 오픈소스로 공개하여 트레이더들이 기능을 검토하고 검증할 수 있도록 했습니다. 작성자에게 찬사를 보냅니다! 이 코드는 무료로 사용할 수 있지만, 코드를 재게시하는 경우 하우스 룰이 적용된다는 점을 기억하세요.
면책사항
해당 정보와 게시물은 금융, 투자, 트레이딩 또는 기타 유형의 조언이나 권장 사항으로 간주되지 않으며, 트레이딩뷰에서 제공하거나 보증하는 것이 아닙니다. 자세한 내용은 이용 약관을 참조하세요.