OPEN-SOURCE SCRIPT
Trend Analyzer MACD Enhanced
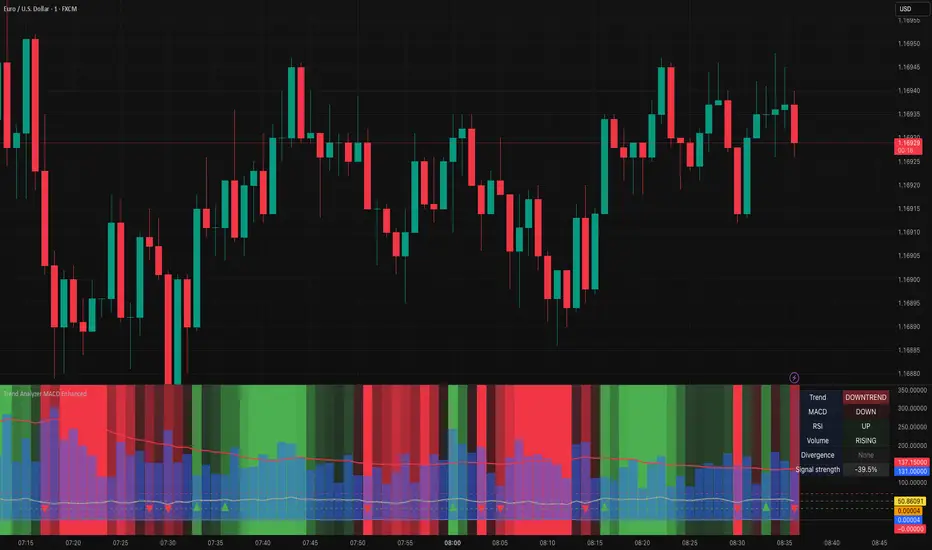
Trend Analyzer MACD Enhanced
Advanced trend analysis with MACD, RSI, Volume and Divergence detection!
Overview
This comprehensive indicator combines multiple technical analysis tools into one powerful visualization. It features dynamic background coloring, real-time signal strength calculation, and automatic divergence detection for complete market analysis.
Key Features
✅ Multi-Indicator Analysis- MACD, RSI, and Volume in one indicator
✅ Divergence Detection - Automatic bullish and bearish divergence identification
✅ Dynamic Background - Color-coded trend zones with smooth transitions
✅ Signal Strength - Weighted calculation showing overall market sentiment (0-100%)
✅ Trend Change Detection - Visual markers for trend reversals
✅ Information Table - Real-time status of all indicators
How It Works
The indicator calculates signal strength using weighted analysis:
- MACD (50%) - Primary trend momentum
- RSI (30%) - Overbought/oversold conditions
- Volume (20%) - Volume confirmation
Signal Strength Range: -100% to +100%
Visual Elements
Background Colors:
- 🟢 **Green** - Uptrend (intensity based on signal strength)
- 🔴 **Red** - Downtrend (intensity based on signal strength)
- ⚪ **Gray** - Neutral/sideways market
Trend Markers:
- 🔺 **Green Triangle Up** - Start of new uptrend
- 🔻 **Red Triangle Down** - Start of new downtrend
- 📏 **Vertical Lines** - Trend change confirmation
Information Table
Real-time display showing:
- Trend - Current trend state with color coding
- MACD - Direction and crossover status
- RSI - Level and overbought/oversold status
- Volume - Level and trend direction
- Divergence - Current divergence status
- Signal Strength- Overall percentage
Alerts
Built-in alerts for:
- Strong Buy/Sell Signals - High probability setups
- Divergence Signals - Early reversal warnings
Settings
MACD:Fast (12), Slow (26), Signal (9)
RSI:Length (14), Overbought (70), Oversold (30)
Volume:MA Length (20), Threshold (1.5x)
Display:Toggle RSI, Volume, and Table visibility
Best Practices
🎯 Works best in trending markets
📊 Use in separate window below main chart
⚡ Combine with price action analysis
🛡️ Always use proper risk management
Pro Tips
- Green background = Strong uptrend, Red background = Strong downtrend
- Signal strength > 50% = Very bullish, < -50% = Very bearish
- Watch for divergence signals for early reversal warnings
- Use the information table for quick market assessment
---
Created with ❤️ for the trading community
This indicator is free to use for both commercial and non-commercial purposes.
오픈 소스 스크립트
트레이딩뷰의 진정한 정신에 따라, 이 스크립트의 작성자는 이를 오픈소스로 공개하여 트레이더들이 기능을 검토하고 검증할 수 있도록 했습니다. 작성자에게 찬사를 보냅니다! 이 코드는 무료로 사용할 수 있지만, 코드를 재게시하는 경우 하우스 룰이 적용된다는 점을 기억하세요.
면책사항
해당 정보와 게시물은 금융, 투자, 트레이딩 또는 기타 유형의 조언이나 권장 사항으로 간주되지 않으며, 트레이딩뷰에서 제공하거나 보증하는 것이 아닙니다. 자세한 내용은 이용 약관을 참조하세요.
오픈 소스 스크립트
트레이딩뷰의 진정한 정신에 따라, 이 스크립트의 작성자는 이를 오픈소스로 공개하여 트레이더들이 기능을 검토하고 검증할 수 있도록 했습니다. 작성자에게 찬사를 보냅니다! 이 코드는 무료로 사용할 수 있지만, 코드를 재게시하는 경우 하우스 룰이 적용된다는 점을 기억하세요.
면책사항
해당 정보와 게시물은 금융, 투자, 트레이딩 또는 기타 유형의 조언이나 권장 사항으로 간주되지 않으며, 트레이딩뷰에서 제공하거나 보증하는 것이 아닙니다. 자세한 내용은 이용 약관을 참조하세요.