INVITE-ONLY SCRIPT
업데이트됨 Banker Chips Turnover & Divergence Index(MYTRIC)
█ OVERVIEW
Development of this toolkit is to understanding information provided by the market in depth before trading.
The main reason for losing money or not being profitable is that you do not understand the information given by the market.
If you master the information given by the market, the number of losses will be greatly reduce.
We composed a lot of algorithms module and innovative indicators,
to provide endless possibilities and meet all trading styles.
Our toolkit works in global trading market and any indices, through algorithms we extract 9️⃣ major information in the market.
Which 9️⃣ major market information are include :
• Overall Trend
• Trend Phase
• Demand & Supply
• Price Risk
• Game Theory
• Banker Chips
• Chart Pattern Meaning
• Business Model (Stocks)
• Companies Financial Health (Stocks)
This indicator provides 1️⃣ market information among the 9️⃣ major information.
The 1 market information as below :
✅ - Banker Chips (banker collect / banker disposed)
【Banker Chips Turnover & Market Divergence Index(MYTRIC)】
❌ - Game Theory
【Bull Bear Momentum Indicator】
❌ - Demand & Supply
【Dt Smart Trend (MYTRIC)】 & 【Bull Bear Momentum Indicator】
❌ - Price Risk
【Dt Smart Trend (MYTRIC)】 & 【Bull Bear Momentum Indicator】
❌ - Overall Trend
【Dt Smart Trend (MYTRIC)】
❌ - Trend Phase
【Dt Smart Trend (MYTRIC)】
❌ - Chart Pattern Meaning
【coming soon】
❌ - Business Model
【we didn't provide】
❌ - Companies Financial Health
【Financial Intelligent Evaluation】
██████████████████████████████████████████████████████████████████████████████████████████████████████████████████████
——————————————————————————————————————————————————————————————————————————————————————————————————————————————————
█ What market information does this indicator tell you ?
The Banker Chips Turnover & Divergence Index(MYTRIC) indicator is telling you 'Banker chips' or 'Market maker' activities.
• Track abnormal trade in the market.
The Banker Chips Turnover & Divergence Index(MYTRIC) indicator used to measure the divergence index of current trend and prices, a way to measure the potential accumulation or distribution of chips by banker or main force.
This indicator are calculation according to the relationship between volume and price, this is one of the methods to quantify "volume & price analysis". Volume & price analysis can provide insight the behavior of banker.
When the index appears at the high of the price, it mean banker may be distributing/disposing, the price is very soon to retracement(if retailer have a big support) or downtrend.
When the index appears at the low of the price, it mean banker may be accumulating/acquiring, if it break-out, the upward trend will be considerable.
The Banker Chips Turnover & Divergence Index(MYTRIC) indicator is used to track 'Banker' collecting & distribution activity.
Let you know the 'Banker' intention in advance to prevent 'Rug-pull or stock scammer' 'Chinese call '割韭菜 or 杀猪盘''.
We also can use this indicator to spot is the current market is a scam or Chinese call '杀猪盘', to avoid losing your huge capital in a moment.
• Usually the histogram bar excessive to 'Extremely High Turnover Area', we will judge it as a scam and '杀猪盘'
██████████████████████████████████████████████████████████████████████████████████████████████████████████████████████
——————————————————————————————————————————————————————————————————————————————————————————————————————————————————
█ CASE STUDY
before case study must know the every color intention.
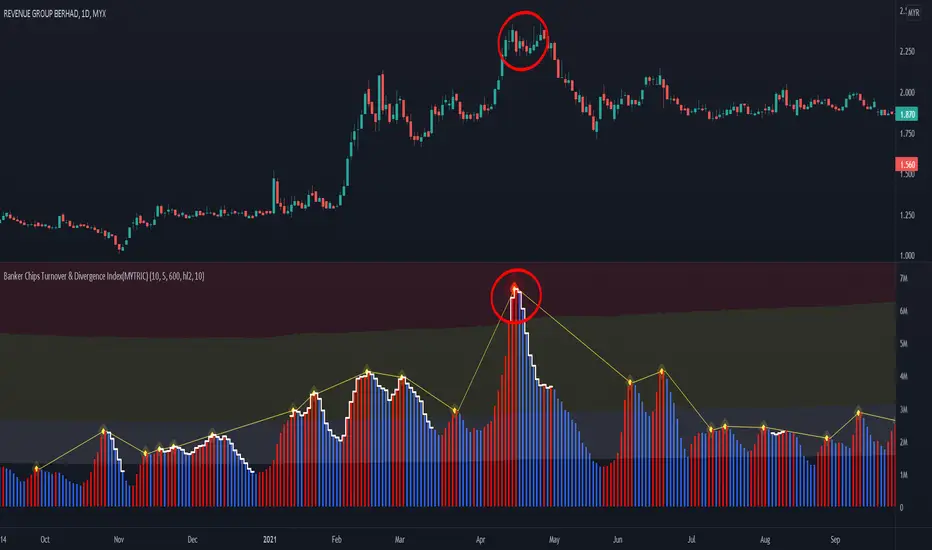
• Histogram Bar = Market divergence index or Banker Chips Turnover Index
• White Step Line Above Bar = High probability of Banker Chips activity
• Red line is only mark up the peak of index above high turnover
• Must be attention when the higher histogram bar in higher level price, the price may fall or plunge after breaking support.
• Must be attention when the higher histogram bar in lower level price, the price may rise or skyrocket after breaking resistant.
Color Description :

Case Study 01 [Scam Stock]:
Scam Stock 1 1343
1343

——————————————————————————————————————————————————————————————————————————————————————————————————————————————————
Scam Stock 2 3893
3893

——————————————————————————————————————————————————————————————————————————————————————————————————————————————————
Scam Stock 3 VINVEST
Vinvest 1 , before pump activity

Vinvest 2 , after dump activity

——————————————————————————————————————————————————————————————————————————————————————————————————————————————————
Case Study 4
 BTCUSDT

English News.
https://www.bloomberg.com/news/articles/2021-05-19/cathie-wood-still-a-bitcoin-believer-sees-it-going-to-500-000
Chinese News.
https://www.chinapress.com.my/20210521/%E5%A5%B3%E8%82%A1%E7%A5%9E-%E9%A9%AC%E6%96%AF%E5%85%8B-%E5%8A%9B%E6%92%91-%E6%AF%94%E7%89%B9%E5%B8%8124%E5%B0%8F%E6%97%B6%E5%8F%8D%E5%BC%B9%E8%BF%9140/
——————————————————————————————————————————————————————————————————————————————————————————————————————————————————
Case Study 5 SCIB
SCIB

Development of this toolkit is to understanding information provided by the market in depth before trading.
The main reason for losing money or not being profitable is that you do not understand the information given by the market.
If you master the information given by the market, the number of losses will be greatly reduce.
We composed a lot of algorithms module and innovative indicators,
to provide endless possibilities and meet all trading styles.
Our toolkit works in global trading market and any indices, through algorithms we extract 9️⃣ major information in the market.
Which 9️⃣ major market information are include :
• Overall Trend
• Trend Phase
• Demand & Supply
• Price Risk
• Game Theory
• Banker Chips
• Chart Pattern Meaning
• Business Model (Stocks)
• Companies Financial Health (Stocks)
This indicator provides 1️⃣ market information among the 9️⃣ major information.
The 1 market information as below :
✅ - Banker Chips (banker collect / banker disposed)
【Banker Chips Turnover & Market Divergence Index(MYTRIC)】
❌ - Game Theory
【Bull Bear Momentum Indicator】
❌ - Demand & Supply
【Dt Smart Trend (MYTRIC)】 & 【Bull Bear Momentum Indicator】
❌ - Price Risk
【Dt Smart Trend (MYTRIC)】 & 【Bull Bear Momentum Indicator】
❌ - Overall Trend
【Dt Smart Trend (MYTRIC)】
❌ - Trend Phase
【Dt Smart Trend (MYTRIC)】
❌ - Chart Pattern Meaning
【coming soon】
❌ - Business Model
【we didn't provide】
❌ - Companies Financial Health
【Financial Intelligent Evaluation】
██████████████████████████████████████████████████████████████████████████████████████████████████████████████████████
——————————————————————————————————————————————————————————————————————————————————————————————————————————————————
█ What market information does this indicator tell you ?
The Banker Chips Turnover & Divergence Index(MYTRIC) indicator is telling you 'Banker chips' or 'Market maker' activities.
• Track abnormal trade in the market.
The Banker Chips Turnover & Divergence Index(MYTRIC) indicator used to measure the divergence index of current trend and prices, a way to measure the potential accumulation or distribution of chips by banker or main force.
This indicator are calculation according to the relationship between volume and price, this is one of the methods to quantify "volume & price analysis". Volume & price analysis can provide insight the behavior of banker.
When the index appears at the high of the price, it mean banker may be distributing/disposing, the price is very soon to retracement(if retailer have a big support) or downtrend.
When the index appears at the low of the price, it mean banker may be accumulating/acquiring, if it break-out, the upward trend will be considerable.
The Banker Chips Turnover & Divergence Index(MYTRIC) indicator is used to track 'Banker' collecting & distribution activity.
Let you know the 'Banker' intention in advance to prevent 'Rug-pull or stock scammer' 'Chinese call '割韭菜 or 杀猪盘''.
We also can use this indicator to spot is the current market is a scam or Chinese call '杀猪盘', to avoid losing your huge capital in a moment.
• Usually the histogram bar excessive to 'Extremely High Turnover Area', we will judge it as a scam and '杀猪盘'
██████████████████████████████████████████████████████████████████████████████████████████████████████████████████████
——————————————————————————————————————————————————————————————————————————————————————————————————————————————————
█ CASE STUDY
before case study must know the every color intention.
• Histogram Bar = Market divergence index or Banker Chips Turnover Index
• White Step Line Above Bar = High probability of Banker Chips activity
• Red line is only mark up the peak of index above high turnover
• Must be attention when the higher histogram bar in higher level price, the price may fall or plunge after breaking support.
• Must be attention when the higher histogram bar in lower level price, the price may rise or skyrocket after breaking resistant.
Color Description :
Case Study 01 [Scam Stock]:
Scam Stock 1
——————————————————————————————————————————————————————————————————————————————————————————————————————————————————
Scam Stock 2
——————————————————————————————————————————————————————————————————————————————————————————————————————————————————
Scam Stock 3
Vinvest 1 , before pump activity
Vinvest 2 , after dump activity
——————————————————————————————————————————————————————————————————————————————————————————————————————————————————
Case Study 4
English News.
https://www.bloomberg.com/news/articles/2021-05-19/cathie-wood-still-a-bitcoin-believer-sees-it-going-to-500-000
Chinese News.
https://www.chinapress.com.my/20210521/%E5%A5%B3%E8%82%A1%E7%A5%9E-%E9%A9%AC%E6%96%AF%E5%85%8B-%E5%8A%9B%E6%92%91-%E6%AF%94%E7%89%B9%E5%B8%8124%E5%B0%8F%E6%97%B6%E5%8F%8D%E5%BC%B9%E8%BF%9140/
——————————————————————————————————————————————————————————————————————————————————————————————————————————————————
Case Study 5
릴리즈 노트
-Fixed background color bugs.초대 전용 스크립트
이 스크립트는 작성자가 승인한 사용자만 접근할 수 있습니다. 사용하려면 요청 후 승인을 받아야 하며, 일반적으로 결제 후에 허가가 부여됩니다. 자세한 내용은 아래 작성자의 안내를 따르거나 MYTRIC에게 직접 문의하세요.
트레이딩뷰는 스크립트의 작동 방식을 충분히 이해하고 작성자를 완전히 신뢰하지 않는 이상, 해당 스크립트에 비용을 지불하거나 사용하는 것을 권장하지 않습니다. 커뮤니티 스크립트에서 무료 오픈소스 대안을 찾아보실 수도 있습니다.
작성자 지시 사항
Please contact me privately to request access. After subscription, this indicator will appear under the "Invite-Only" script in the indicator panel.
Get instant access here => https://www.mytric.co/
English ver. Youtube Channel : youtube.com/@mytricalgo
Chinese ver. Youtube Channel : youtube.com/@MytricAlgo算法系统
Chinese ver. Youtube Channel : youtube.com/@MytricAlgo算法系统
면책사항
해당 정보와 게시물은 금융, 투자, 트레이딩 또는 기타 유형의 조언이나 권장 사항으로 간주되지 않으며, 트레이딩뷰에서 제공하거나 보증하는 것이 아닙니다. 자세한 내용은 이용 약관을 참조하세요.
초대 전용 스크립트
이 스크립트는 작성자가 승인한 사용자만 접근할 수 있습니다. 사용하려면 요청 후 승인을 받아야 하며, 일반적으로 결제 후에 허가가 부여됩니다. 자세한 내용은 아래 작성자의 안내를 따르거나 MYTRIC에게 직접 문의하세요.
트레이딩뷰는 스크립트의 작동 방식을 충분히 이해하고 작성자를 완전히 신뢰하지 않는 이상, 해당 스크립트에 비용을 지불하거나 사용하는 것을 권장하지 않습니다. 커뮤니티 스크립트에서 무료 오픈소스 대안을 찾아보실 수도 있습니다.
작성자 지시 사항
Please contact me privately to request access. After subscription, this indicator will appear under the "Invite-Only" script in the indicator panel.
Get instant access here => https://www.mytric.co/
English ver. Youtube Channel : youtube.com/@mytricalgo
Chinese ver. Youtube Channel : youtube.com/@MytricAlgo算法系统
Chinese ver. Youtube Channel : youtube.com/@MytricAlgo算法系统
면책사항
해당 정보와 게시물은 금융, 투자, 트레이딩 또는 기타 유형의 조언이나 권장 사항으로 간주되지 않으며, 트레이딩뷰에서 제공하거나 보증하는 것이 아닙니다. 자세한 내용은 이용 약관을 참조하세요.