OPEN-SOURCE SCRIPT
Indicator: Derivative Oscillator
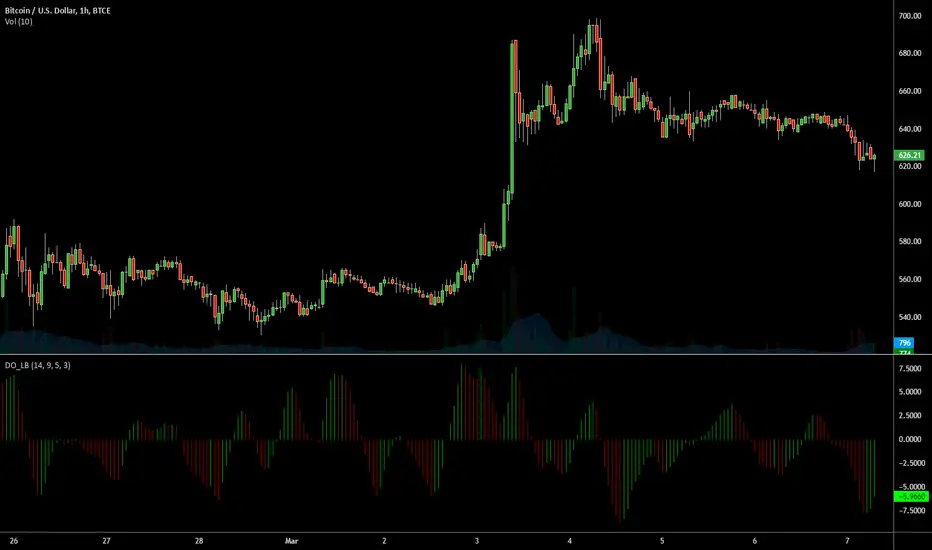
Constance Brown's Derivative Oscillator was published in her book "Technical Analysis for the Trading Professional".
The oscillator uses a 14-period RSI. The RSI is then double smoothed with exponential moving averages. The default settings for the smoothing periods are 5 and 3.
In a second step a signal line is generated from the smoothed RSI by calculating a simple moving average with a period of 9.
The Derivative Oscillator is calculated as the difference between the smoothed RSI and the signal line and displayed as histogram.
All the values are configurable.
오픈 소스 스크립트
트레이딩뷰의 진정한 정신에 따라, 이 스크립트의 작성자는 이를 오픈소스로 공개하여 트레이더들이 기능을 검토하고 검증할 수 있도록 했습니다. 작성자에게 찬사를 보냅니다! 이 코드는 무료로 사용할 수 있지만, 코드를 재게시하는 경우 하우스 룰이 적용된다는 점을 기억하세요.
List of my free indicators: bit.ly/1LQaPK8
List of my indicators at Appstore: blog.tradingview.com/?p=970
List of my indicators at Appstore: blog.tradingview.com/?p=970
면책사항
해당 정보와 게시물은 금융, 투자, 트레이딩 또는 기타 유형의 조언이나 권장 사항으로 간주되지 않으며, 트레이딩뷰에서 제공하거나 보증하는 것이 아닙니다. 자세한 내용은 이용 약관을 참조하세요.