OPEN-SOURCE SCRIPT
Multiple HMA
Original Indicator Script for calculation and color change Hull Ma written and published by huyfibo
I found his version preferable and superior due to the method of mathematics used to get the Hull Ma
I have duplicated huyfibo's calculation for 1 line multiple times, changed variables on each one to create 12 total lines, and customized the color and width of each to help them be identifiable on the 1 minute chart.
This indicator was requested and written for a study to replace multiple SMA's with Hull MAs to compare accuracy as the Hull has much less lag.
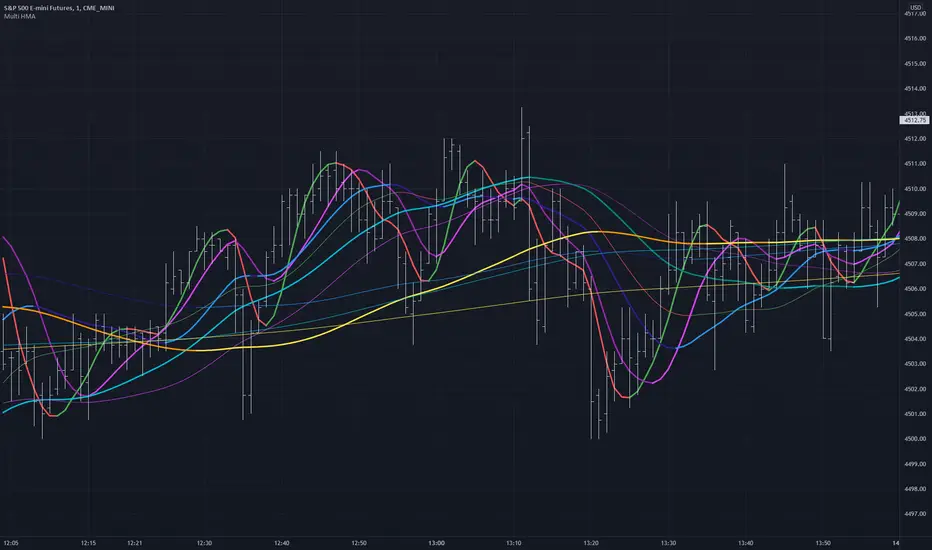
As you can see on the above chart, it displays both the 200(1 min) and 1000 ( 5 min) HMA in gold . If user was watching the 1 min chart expecting price to resist at the 200, it would not hold. Although on the 5 min chart it does. This combination gives the user the expectation that price could jump the first line and resist at the second, which it does here.
Combining multiple lines into 1 also to take up much less room at the top of the chart for cleaner visual.
Default values are as such so that the user can have 5 min values displayed on a 1 min chart, as well as the equiv of 200 on the 30 min chart for the 2 and 4 hour.
This is a simply a matter of convenience for the study and can be unchecked to be hidden.
Coded colors and lengths are to visually discern comparable values. Both 1 and 5 min timeframes are the same color, but 1 min timeframe value has larger linewidth
Hull # 10 and 11 are intended for 30 min timeframe and should be unchecked for anything less as their value with be invalid.
All period values, color combinations, and line width can be changed in the the input menu.
I found his version preferable and superior due to the method of mathematics used to get the Hull Ma
I have duplicated huyfibo's calculation for 1 line multiple times, changed variables on each one to create 12 total lines, and customized the color and width of each to help them be identifiable on the 1 minute chart.
This indicator was requested and written for a study to replace multiple SMA's with Hull MAs to compare accuracy as the Hull has much less lag.
As you can see on the above chart, it displays both the 200(1 min) and 1000 ( 5 min) HMA in gold . If user was watching the 1 min chart expecting price to resist at the 200, it would not hold. Although on the 5 min chart it does. This combination gives the user the expectation that price could jump the first line and resist at the second, which it does here.
Combining multiple lines into 1 also to take up much less room at the top of the chart for cleaner visual.
Default values are as such so that the user can have 5 min values displayed on a 1 min chart, as well as the equiv of 200 on the 30 min chart for the 2 and 4 hour.
This is a simply a matter of convenience for the study and can be unchecked to be hidden.
Coded colors and lengths are to visually discern comparable values. Both 1 and 5 min timeframes are the same color, but 1 min timeframe value has larger linewidth
Hull # 10 and 11 are intended for 30 min timeframe and should be unchecked for anything less as their value with be invalid.
All period values, color combinations, and line width can be changed in the the input menu.
오픈 소스 스크립트
트레이딩뷰의 진정한 정신에 따라, 이 스크립트의 작성자는 이를 오픈소스로 공개하여 트레이더들이 기능을 검토하고 검증할 수 있도록 했습니다. 작성자에게 찬사를 보냅니다! 이 코드는 무료로 사용할 수 있지만, 코드를 재게시하는 경우 하우스 룰이 적용된다는 점을 기억하세요.
면책사항
해당 정보와 게시물은 금융, 투자, 트레이딩 또는 기타 유형의 조언이나 권장 사항으로 간주되지 않으며, 트레이딩뷰에서 제공하거나 보증하는 것이 아닙니다. 자세한 내용은 이용 약관을 참조하세요.
오픈 소스 스크립트
트레이딩뷰의 진정한 정신에 따라, 이 스크립트의 작성자는 이를 오픈소스로 공개하여 트레이더들이 기능을 검토하고 검증할 수 있도록 했습니다. 작성자에게 찬사를 보냅니다! 이 코드는 무료로 사용할 수 있지만, 코드를 재게시하는 경우 하우스 룰이 적용된다는 점을 기억하세요.
면책사항
해당 정보와 게시물은 금융, 투자, 트레이딩 또는 기타 유형의 조언이나 권장 사항으로 간주되지 않으며, 트레이딩뷰에서 제공하거나 보증하는 것이 아닙니다. 자세한 내용은 이용 약관을 참조하세요.