INVITE-ONLY SCRIPT
업데이트됨 (CD|RS Signal) Caruso Divergence Relative Strength Signal
CD|RS Signal allows for plotting horizontal bars to isolate periods where a security is forming a positive divergence from its benchmark, therefore, producing positive Relative strength when accounting for the security's volatility.
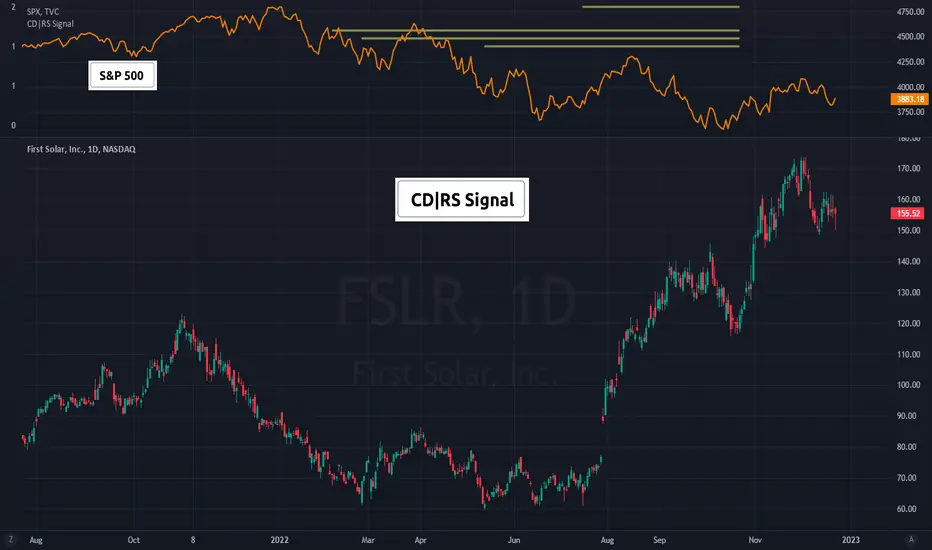
Investors can set how many 'pivots' or lows back to use when making an analysis. CD|RS Signal has an algorithm to identify pats market lows and automatically line them up with a stock's low around the same period of time. This allows for divergence analysis across many past lows and helps to isolate positive price divergences that are not so clear in choppy sideways trading action. CD|RS Signal helps an investor to identify when a security does not make a lower low vs a benchmark that has made a lower low over a similar period.
To help visualize the meaning behind the indicator, CD|RS Signal can be plotted in a separate pane, ideally over the benchmark itself. Traditionally the S&P500 is used for US stock analysis. By overlaying CD|RS Signal over the S&P 500, investors can more easily view which S&P 500 lows the stock is currently showing a positive divergence with.
This indicator allows you to select both your benchmark for comparing against as investors may prefer a commodity crypto currency or another stock. As well, users cans elect as far back to make the analysis by selecting the pivot lookback (how many prior ‘pivots’ or ‘market lows’ back to compare against).
In addition, to perform the historical study, investors can turn on historical HLs in the settings enabling all past CD|RS signals to show. This helps an investor to visualize how this has functioned on a security in the past.
릴리즈 노트
Version 2.0■ Support for all symbol types.
■ Add option to change RT line color and width.
초대 전용 스크립트
이 스크립트는 작성자가 승인한 사용자만 접근할 수 있습니다. 사용하려면 요청 후 승인을 받아야 하며, 일반적으로 결제 후에 허가가 부여됩니다. 자세한 내용은 아래 작성자의 안내를 따르거나 CarusoInsights에게 직접 문의하세요.
트레이딩뷰는 스크립트의 작동 방식을 충분히 이해하고 작성자를 완전히 신뢰하지 않는 이상, 해당 스크립트에 비용을 지불하거나 사용하는 것을 권장하지 않습니다. 커뮤니티 스크립트에서 무료 오픈소스 대안을 찾아보실 수도 있습니다.
작성자 지시 사항
Get access to CarusoInsights indicators: https://www.carusoinsights.com/charting/
Get access to CarusoInsights indicators: carusoinsights.com/charting/
면책사항
해당 정보와 게시물은 금융, 투자, 트레이딩 또는 기타 유형의 조언이나 권장 사항으로 간주되지 않으며, 트레이딩뷰에서 제공하거나 보증하는 것이 아닙니다. 자세한 내용은 이용 약관을 참조하세요.