INVITE-ONLY SCRIPT
3D Trailing Stop
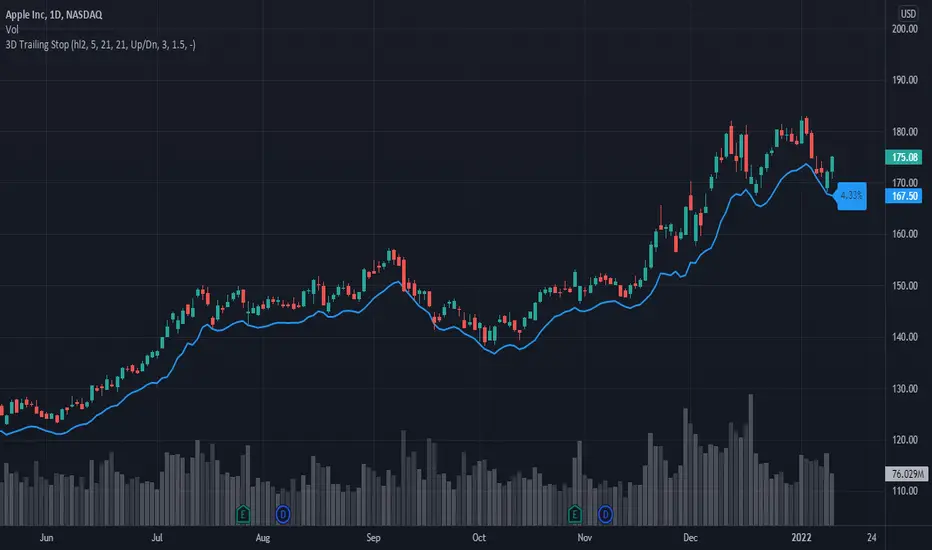
3D Trailing Stop is an indicator designed to keep you in trend trades and let you know when it may be a good time to exit. It's calculation is based on the Trend, Volatility and Volume pattern of the instrument. Instead of most trailing stops which are based on 1 measurement, it's based on 3 measurements, hence it's name 3D Trailing Stop, which is short for 3-Dimensional.
For example when looking at a long-only trade, the more up days and the more volume on those up days, the wider the trailing stop will be. However when the trend changes, and there's more down days with more volume then the trailing stop will tighten. The idea is to try and keep us in good trends for longer and get out of reversing trends earlier.
The default distance the trailing stop will be from the EMA (5) is always a multiple of 1.5 - 3x the ATR (21) and all of these settings are changeable by the user. To change the trailing stop from the default long trend to short trend change the ATR Offset setting from - to +. If you wish to display both a long and short trailing stop, simply add the indicator again to your chart with the ATR Offset + setting enabled. The indicator also shows how far the trailing stop price is from the last price, expressed as a % on the chart so you can easily see how far away the trailing stop is.
There are a few ways it can be used, for example one may wish to enter on a 50 or 100 bar high/low breakout and use the 3D Trailing Stop as a indicator when to get out of the trade. You could exit once price goes below the trailing stop, or use the previous bar trailing stop value as the level for a quicker exit.
This indicator can be used on any market and any timeframe, for both long and short trades. We have found it to work best on stocks long-only using the daily timeframe as stocks tend to have good up-trends over time. You could also use it on smaller timeframes in conjunction with other indicators and signals to enhance your win rate.
To get access PM or email me to my address shown below.
Enjoy :)
Disclaimer: All my scripts and content are for educational purposes only. I'm not a financial advisor and do not give personal finance advice. Past performance is no guarantee of future performance. Please trade at your own risk.
초대 전용 스크립트
이 스크립트는 작성자가 승인한 사용자만 접근할 수 있습니다. 사용하려면 요청 후 승인을 받아야 하며, 일반적으로 결제 후에 허가가 부여됩니다. 자세한 내용은 아래 작성자의 안내를 따르거나 Click-Capital에게 직접 문의하세요.
트레이딩뷰는 스크립트의 작동 방식을 충분히 이해하고 작성자를 완전히 신뢰하지 않는 이상, 해당 스크립트에 비용을 지불하거나 사용하는 것을 권장하지 않습니다. 커뮤니티 스크립트에서 무료 오픈소스 대안을 찾아보실 수도 있습니다.
작성자 지시 사항
Contact me using TradingView private chat or email me at scale@greenstonedigital.com to request access to my invite-only scripts.
면책사항
해당 정보와 게시물은 금융, 투자, 트레이딩 또는 기타 유형의 조언이나 권장 사항으로 간주되지 않으며, 트레이딩뷰에서 제공하거나 보증하는 것이 아닙니다. 자세한 내용은 이용 약관을 참조하세요.