OPEN-SOURCE SCRIPT
Orion:Supertrend Hybrid
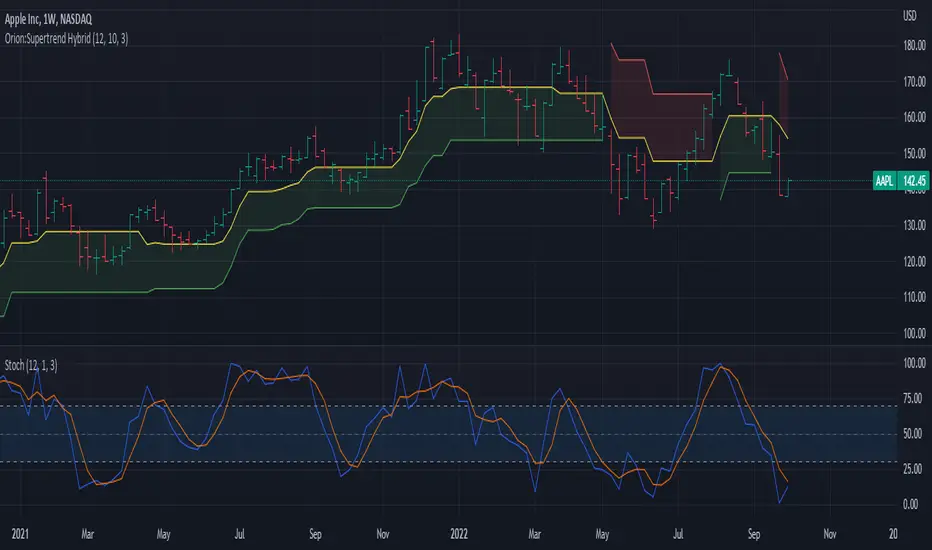
Supertrend Hybrid
This indicator is a combination of the Supertrend and Donchian Channels.
The original Supertrend indicator shades the area from the mean (hl2) of the bar/candle to the Supertrend line.
This Hybrid uses the mid section of the Donchian channel to the Supertrend line as the area to be shaded.
This provides a visual of when prices are getting close to potentially reversing the trend.
Values:
Length = Length of the Donchian Channels (Default: 12)
ATR Length = Lookback length of the ATR calculation (Default: 10)
Factor = Multiply the ATR by this value to get a trend reversal value (Default: 3.0)
Prices cross above the red line indicating a bullish trend is in play
Prices cross below the green line indicating a bearish trend is in play
Yellow line represents the mid-section of the Donchian Channel.
Suggested usage:
Add a Stochastic and set the Stochastic %K Length to the same value as the Donchian Length.
When below trend (red line dominate) and prices cross into the shaded area, if stochastic crosses above 70, prices may challenge/cross the red trend line.
When above trend (green line dominate) and prices cross into the shaded area, if stochastic crosses below 30, prices may challenge/cross the green trend line.
IF in an up trend (green line dominate) and stochastic crosses/remains above 70, potential higher price movement exists.
IF in an down trend (red line dominate) and stochastic crosses/remains below 30, potential lower price movement exists.
오픈 소스 스크립트
트레이딩뷰의 진정한 정신에 따라, 이 스크립트의 작성자는 이를 오픈소스로 공개하여 트레이더들이 기능을 검토하고 검증할 수 있도록 했습니다. 작성자에게 찬사를 보냅니다! 이 코드는 무료로 사용할 수 있지만, 코드를 재게시하는 경우 하우스 룰이 적용된다는 점을 기억하세요.
면책사항
해당 정보와 게시물은 금융, 투자, 트레이딩 또는 기타 유형의 조언이나 권장 사항으로 간주되지 않으며, 트레이딩뷰에서 제공하거나 보증하는 것이 아닙니다. 자세한 내용은 이용 약관을 참조하세요.
오픈 소스 스크립트
트레이딩뷰의 진정한 정신에 따라, 이 스크립트의 작성자는 이를 오픈소스로 공개하여 트레이더들이 기능을 검토하고 검증할 수 있도록 했습니다. 작성자에게 찬사를 보냅니다! 이 코드는 무료로 사용할 수 있지만, 코드를 재게시하는 경우 하우스 룰이 적용된다는 점을 기억하세요.
면책사항
해당 정보와 게시물은 금융, 투자, 트레이딩 또는 기타 유형의 조언이나 권장 사항으로 간주되지 않으며, 트레이딩뷰에서 제공하거나 보증하는 것이 아닙니다. 자세한 내용은 이용 약관을 참조하세요.