OPEN-SOURCE SCRIPT
Pure Coca
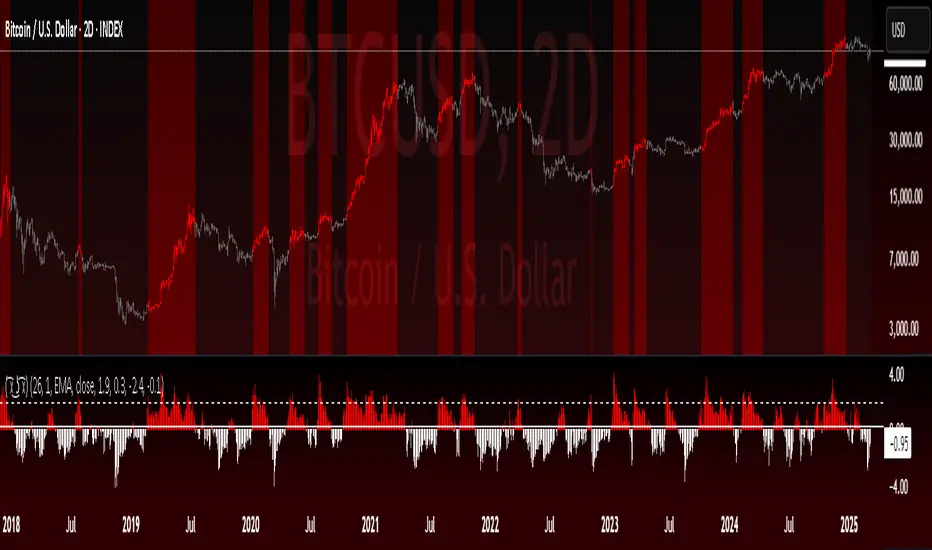
Pure Coca - Trend & Mean Reversion Indicator
Overview
The Pure Coca indicator is a trend and mean reversion analysis tool designed for identifying dynamic shifts in market behavior. By leveraging Z-score calculations, this indicator captures both trend-following and mean-reverting periods, making it useful for a wide range of trading strategies.
What It Does
📉 Detects Overbought & Oversold Conditions using a Z-score framework.
🎯 Identifies Trend vs. Mean Reversion Phases by analyzing the deviation of price from its historical average.
📊 Customizable Moving Averages (EMA, SMA, VWMA, etc.) for smoothing Z-score calculations.
🔄 Adaptable to Any Timeframe – Default settings are optimized for 2D charts but can be adjusted to suit different market conditions.
How It Works
Computes a Z-score of price movements, normalized over a lookback period.
Plots upper and lower boundaries to visualize extreme price movements.
Dynamic Midlines adjust entry and exit conditions based on market shifts.
Background & Bar Coloring help traders quickly identify trading opportunities.
Key Features & Inputs
✔ Lookback Period: Adjustable period for calculating Z-score.
✔ Custom MA Smoothing: Choose from EMA, SMA, WMA, VWAP, and more.
✔ Z-Score Thresholds: Set upper and lower bounds to define overbought/oversold conditions.
✔ Trend vs. Mean Reversion Mode: Enables traders to spot momentum shifts in real-time.
✔ Bar Coloring & Background Highlights: Enhances visual clarity for decision-making.
How to Use It
Trend Trading: Enter when the Z-score crosses key levels (upper/lower boundary).
Mean Reversion: Look for reversals when price returns to the midline.
Custom Optimization: Adjust lookback periods and MA types based on market conditions.
Why It's Unique
✅ Combines Trend & Mean Reversion Analysis in one indicator.
✅ Flexible Z-score settings & MA choices for enhanced adaptability.
✅ Clear visual representation of market extremes.
Final Notes
This indicator is best suited for discretionary traders, quantitative analysts, and systematic traders looking for data-driven market insights. As with any trading tool, use in conjunction with other analysis methods for optimal results.
오픈 소스 스크립트
트레이딩뷰의 진정한 정신에 따라, 이 스크립트의 작성자는 이를 오픈소스로 공개하여 트레이더들이 기능을 검토하고 검증할 수 있도록 했습니다. 작성자에게 찬사를 보냅니다! 이 코드는 무료로 사용할 수 있지만, 코드를 재게시하는 경우 하우스 룰이 적용된다는 점을 기억하세요.
면책사항
해당 정보와 게시물은 금융, 투자, 트레이딩 또는 기타 유형의 조언이나 권장 사항으로 간주되지 않으며, 트레이딩뷰에서 제공하거나 보증하는 것이 아닙니다. 자세한 내용은 이용 약관을 참조하세요.
오픈 소스 스크립트
트레이딩뷰의 진정한 정신에 따라, 이 스크립트의 작성자는 이를 오픈소스로 공개하여 트레이더들이 기능을 검토하고 검증할 수 있도록 했습니다. 작성자에게 찬사를 보냅니다! 이 코드는 무료로 사용할 수 있지만, 코드를 재게시하는 경우 하우스 룰이 적용된다는 점을 기억하세요.
면책사항
해당 정보와 게시물은 금융, 투자, 트레이딩 또는 기타 유형의 조언이나 권장 사항으로 간주되지 않으며, 트레이딩뷰에서 제공하거나 보증하는 것이 아닙니다. 자세한 내용은 이용 약관을 참조하세요.