OPEN-SOURCE SCRIPT
업데이트됨 R-I-ORB
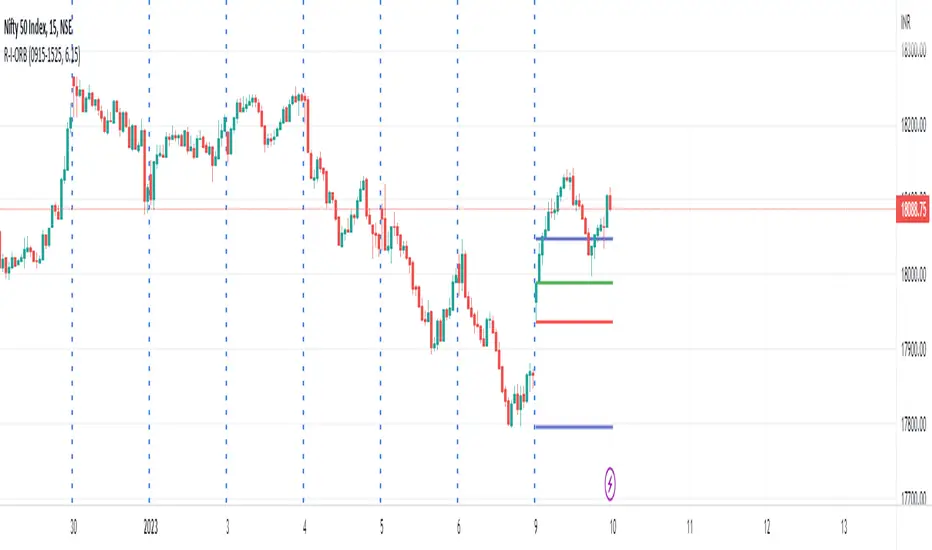
This is an intraday indicator which plots high and low of timeframe's first bar.
Top line - High of the first session bar
Bottom line - low of the first session bar
Requires session timing and total trading hours to plot the lines appropriately.
We can use the indicator to trade intraday opening range breakouts.
Thanks!
Top line - High of the first session bar
Bottom line - low of the first session bar
Requires session timing and total trading hours to plot the lines appropriately.
We can use the indicator to trade intraday opening range breakouts.
Thanks!
릴리즈 노트
Update : Color customization by user릴리즈 노트
Added new lines,PDH - Previous Day High
PDL - Previous Day Low
Plot Historical lines - Plot ORB, PDH & PDL lines to historical data. This setting is turned off by default. It can be turned on if we need to plot lines on historical bars.
Colors can be changed for PDH & PDL values.
릴리즈 노트
Risk Disclosure: This indicator does not provide buy/sell signals and relies on past data, which may not accurately reflect future outcomes. We are not liable for any profits or losses incurred. Please assess and trade at your own risk.오픈 소스 스크립트
트레이딩뷰의 진정한 정신에 따라, 이 스크립트의 작성자는 이를 오픈소스로 공개하여 트레이더들이 기능을 검토하고 검증할 수 있도록 했습니다. 작성자에게 찬사를 보냅니다! 이 코드는 무료로 사용할 수 있지만, 코드를 재게시하는 경우 하우스 룰이 적용된다는 점을 기억하세요.
면책사항
해당 정보와 게시물은 금융, 투자, 트레이딩 또는 기타 유형의 조언이나 권장 사항으로 간주되지 않으며, 트레이딩뷰에서 제공하거나 보증하는 것이 아닙니다. 자세한 내용은 이용 약관을 참조하세요.
오픈 소스 스크립트
트레이딩뷰의 진정한 정신에 따라, 이 스크립트의 작성자는 이를 오픈소스로 공개하여 트레이더들이 기능을 검토하고 검증할 수 있도록 했습니다. 작성자에게 찬사를 보냅니다! 이 코드는 무료로 사용할 수 있지만, 코드를 재게시하는 경우 하우스 룰이 적용된다는 점을 기억하세요.
면책사항
해당 정보와 게시물은 금융, 투자, 트레이딩 또는 기타 유형의 조언이나 권장 사항으로 간주되지 않으며, 트레이딩뷰에서 제공하거나 보증하는 것이 아닙니다. 자세한 내용은 이용 약관을 참조하세요.