PROTECTED SOURCE SCRIPT
Dynamic Pivot Point
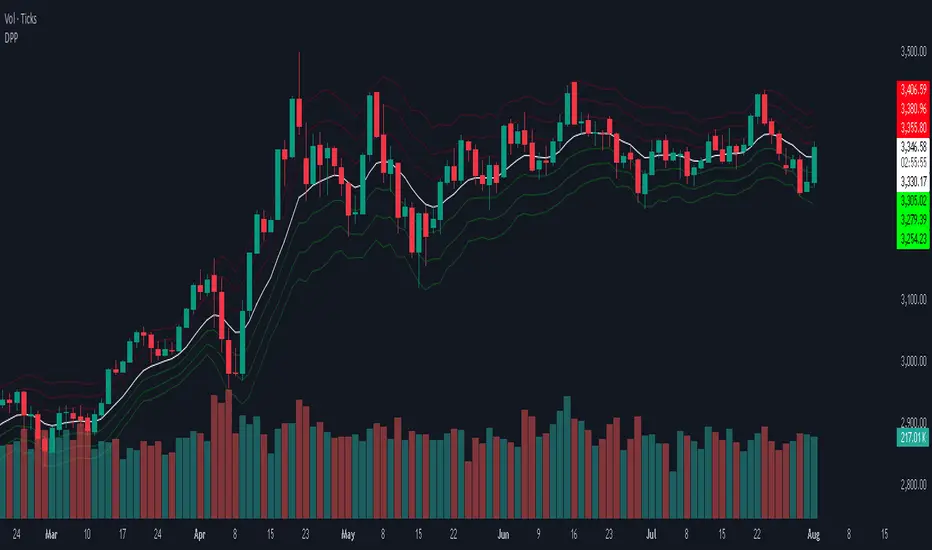
This indicator calculates and displays dynamic pivot points (Pivot, Support, and Resistance levels) based on a selected timeframe. These levels help traders identify potential price reversal zones, support/resistance, and trend direction.
it calculates:
Support Levels (S1, S2, S3)
Resistance Levels (R1, R2, R3)
Dynamic Feature:
a pivot defined period ( default = 5). you can change .
You can choose a specific timeframe (pivotTimeFrame) for calculating pivot levels (e.g., Daily, Weekly, etc.).
Visibility Toggle:
You can turn the pivot levels on or off using the input toggle.
Color Scheme:
Pivot Line: White
Support Levels: Green (S1, S2, S3)
Resistance Levels: Red (R1, R2, R3)
How to Trade With It:
1. Support and Resistance Reversals:
Buy near support levels (S1, S2, S3) if price shows bullish reversal signals.
Sell near resistance levels (R1, R2, R3) if price shows bearish reversal signals.
2. Breakout Trading:
Break above R1/R2/R3 with strong volume may indicate a bullish breakout — consider long positions.
Break below S1/S2/S3 may signal a bearish breakout — consider short positions.
3. Trend Confirmation:
If price stays above Pivot and supports hold — trend is likely bullish.
If price stays below Pivot and resistances hold — trend is likely bearish.
보호된 스크립트입니다
이 스크립트는 비공개 소스로 게시됩니다. 하지만 제한 없이 자유롭게 사용할 수 있습니다 — 여기에서 자세히 알아보기.
면책사항
이 정보와 게시물은 TradingView에서 제공하거나 보증하는 금융, 투자, 거래 또는 기타 유형의 조언이나 권고 사항을 의미하거나 구성하지 않습니다. 자세한 내용은 이용 약관을 참고하세요.
보호된 스크립트입니다
이 스크립트는 비공개 소스로 게시됩니다. 하지만 제한 없이 자유롭게 사용할 수 있습니다 — 여기에서 자세히 알아보기.
면책사항
이 정보와 게시물은 TradingView에서 제공하거나 보증하는 금융, 투자, 거래 또는 기타 유형의 조언이나 권고 사항을 의미하거나 구성하지 않습니다. 자세한 내용은 이용 약관을 참고하세요.