OPEN-SOURCE SCRIPT
RSI Call-outs Multi-resolution [BigBitsIO]
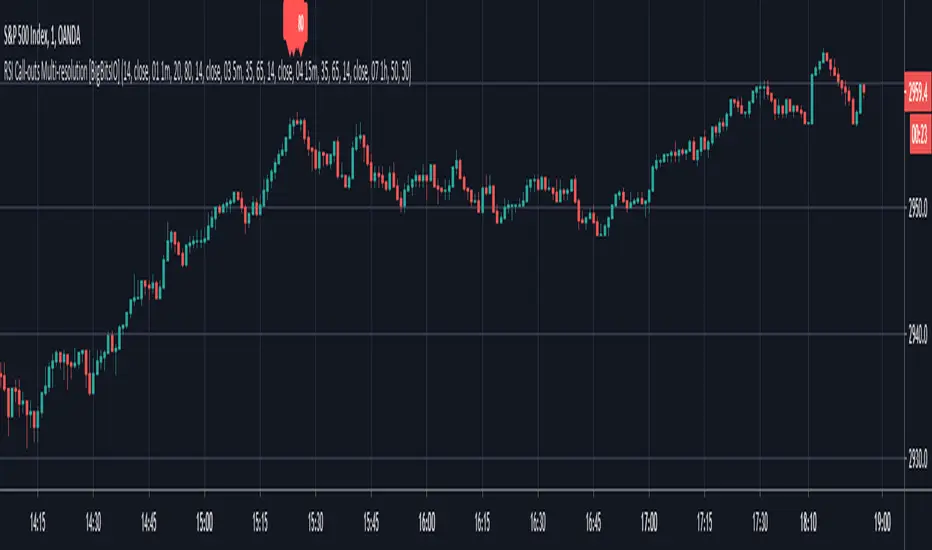
This is a simple multi-resolution (multi-timeframe) RSI indicator that overlays the current chart to show labels for specified oversold and overbought areas defined with inputs.
Up to 4 different resolutions/timeframes for their respective RSI (1,2,3, or 4). RSI1 is always enabled and can not be disabled.
Red labels with white text represent overbought RSI levels as defined by the user. All enabled RSI will have to qualify as overbought based on settings.
Green labels with black test represent oversold RSI levels as defined by the user. All enabled RSI will have to qualify as oversold based on settings.
This RSI overlay help easily call-out overbought and oversold candles on a chart where other RSI values on larger resolutions/timeframes are also oversold/overbought without sacrificing screen space for a traditional RSI indicator that is not overlayed on the chart.
This indicator has alert conditions that will trigger when all enabled RSI indicators are either oversold or overbought respective to your settings.
Note: The best results are to operate your chart as your smallest RSI resolution selected. Personally, I prefer to have my smallest (shortest timeframe) in RSI1, and go larger farther out to RSI4.
오픈 소스 스크립트
트레이딩뷰의 진정한 정신에 따라, 이 스크립트의 작성자는 이를 오픈소스로 공개하여 트레이더들이 기능을 검토하고 검증할 수 있도록 했습니다. 작성자에게 찬사를 보냅니다! 이 코드는 무료로 사용할 수 있지만, 코드를 재게시하는 경우 하우스 룰이 적용된다는 점을 기억하세요.
Like and follow!
💻 Website: bigbits.io
📺 YouTube: youtube.com/bigbits
🎮 Discord: discord.gg/rapMn4z
🐦 Twitter: twitter.com/BigBitsIO
💸 Save $30 on TradingView Paid Plan: bit.ly/2CaRfjs
💻 Website: bigbits.io
📺 YouTube: youtube.com/bigbits
🎮 Discord: discord.gg/rapMn4z
🐦 Twitter: twitter.com/BigBitsIO
💸 Save $30 on TradingView Paid Plan: bit.ly/2CaRfjs
면책사항
해당 정보와 게시물은 금융, 투자, 트레이딩 또는 기타 유형의 조언이나 권장 사항으로 간주되지 않으며, 트레이딩뷰에서 제공하거나 보증하는 것이 아닙니다. 자세한 내용은 이용 약관을 참조하세요.