OPEN-SOURCE SCRIPT
업데이트됨 MM Market Range Map
What this script does:
The purpose of this script is to help traders identify when the major sectors of the market are moving in one direction - also known as a "market trend day".
How this script works:
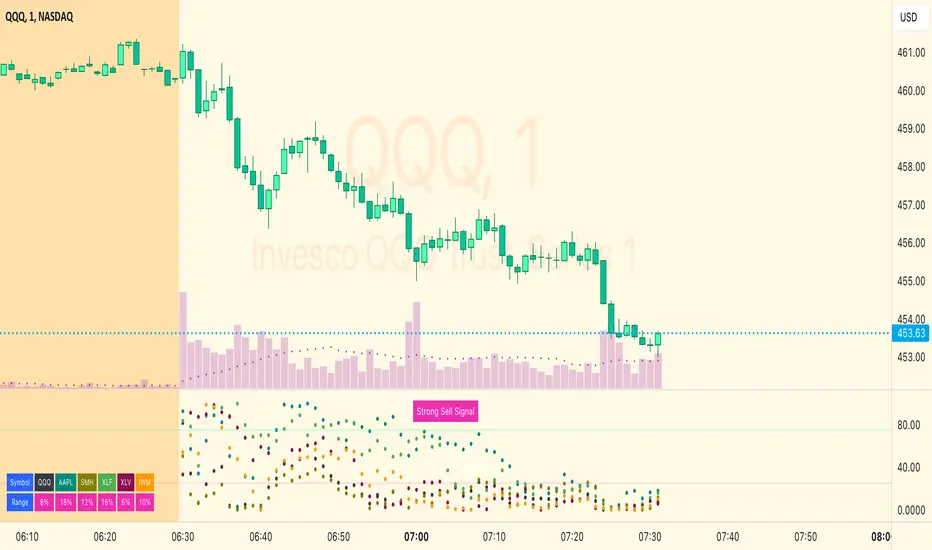
The indicator uses QQQ, SMH and NVDA to represent the technology side of the market, and XLF, XLV & IWM to represent everything else. It tracks where price is within the day's range for each of those symbols, and presents that data in a table and in also in a dot-based "map".
How to use this script:
Using the dot-based map, you can see if all symbols were ever at the highs or lows of their range together. You can use this information to decide which direction you should be trading (ie. with trend). For example, in order for there to be healthy bullish moves in the market, you would want this indicator to show you that all sectors are at the highs or trending in that direction.
What makes this script original:
Most indicators and even the TradingView watchlist measure the percent changed on the day from the closing price of a stock on the prior trading day, essentially telling you what sentiment is since yesterday. This script tells you the sentiment today since it is priced from the opening print. It also provides the map so you can see if they were ever at the highs or lows together throughout the day, which can be an early indicator that the market will trend.
The purpose of this script is to help traders identify when the major sectors of the market are moving in one direction - also known as a "market trend day".
How this script works:
The indicator uses QQQ, SMH and NVDA to represent the technology side of the market, and XLF, XLV & IWM to represent everything else. It tracks where price is within the day's range for each of those symbols, and presents that data in a table and in also in a dot-based "map".
How to use this script:
Using the dot-based map, you can see if all symbols were ever at the highs or lows of their range together. You can use this information to decide which direction you should be trading (ie. with trend). For example, in order for there to be healthy bullish moves in the market, you would want this indicator to show you that all sectors are at the highs or trending in that direction.
What makes this script original:
Most indicators and even the TradingView watchlist measure the percent changed on the day from the closing price of a stock on the prior trading day, essentially telling you what sentiment is since yesterday. This script tells you the sentiment today since it is priced from the opening print. It also provides the map so you can see if they were ever at the highs or lows together throughout the day, which can be an early indicator that the market will trend.
릴리즈 노트
Updates:- Switched NVDA with AAPL to get a better sense of tech overall (SMH should account for NVDA)
- Added sentiment thresholds & lines for those levels (optionally)
- Added alerts for (a) all sectors at lows, (b) all sectors at highs, and (c) healthy sector rotation
- Added strong buy or sell signal messages
릴리즈 노트
Added alerts for just QQQ, XLF, XLV at highs/lows. Updating chart.릴리즈 노트
Fixed a bug where the values didn't display on non-equities charts.릴리즈 노트
Changed the indicator to allow users to customize or disable the symbols. Had to change the alerts also to account for this change. Now it will only alert when all enabled symbols are at highs or lows.오픈 소스 스크립트
트레이딩뷰의 진정한 정신에 따라, 이 스크립트의 작성자는 이를 오픈소스로 공개하여 트레이더들이 기능을 검토하고 검증할 수 있도록 했습니다. 작성자에게 찬사를 보냅니다! 이 코드는 무료로 사용할 수 있지만, 코드를 재게시하는 경우 하우스 룰이 적용된다는 점을 기억하세요.
I release TradingView indicators and libraries designed to make you a better trader. For detailed info about them, head over to improve.trading
면책사항
해당 정보와 게시물은 금융, 투자, 트레이딩 또는 기타 유형의 조언이나 권장 사항으로 간주되지 않으며, 트레이딩뷰에서 제공하거나 보증하는 것이 아닙니다. 자세한 내용은 이용 약관을 참조하세요.
오픈 소스 스크립트
트레이딩뷰의 진정한 정신에 따라, 이 스크립트의 작성자는 이를 오픈소스로 공개하여 트레이더들이 기능을 검토하고 검증할 수 있도록 했습니다. 작성자에게 찬사를 보냅니다! 이 코드는 무료로 사용할 수 있지만, 코드를 재게시하는 경우 하우스 룰이 적용된다는 점을 기억하세요.
I release TradingView indicators and libraries designed to make you a better trader. For detailed info about them, head over to improve.trading
면책사항
해당 정보와 게시물은 금융, 투자, 트레이딩 또는 기타 유형의 조언이나 권장 사항으로 간주되지 않으며, 트레이딩뷰에서 제공하거나 보증하는 것이 아닙니다. 자세한 내용은 이용 약관을 참조하세요.